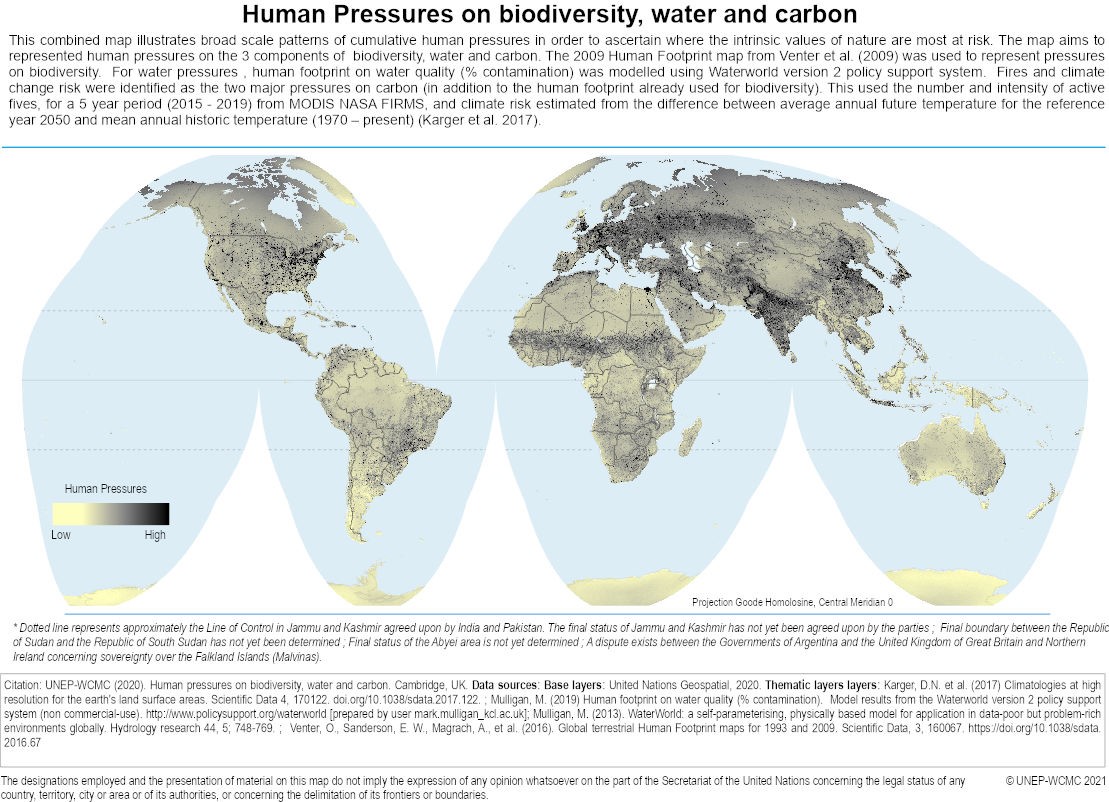
Human Pressures on biodiversity, water and carbon
Date published: February 2021
Select a Licence
CC BY Attribution-ShareAlike 4.0 International
AccessWhat is this?
Use of this product is permitted with attribution. If you adapt this product, you must remove the UN emblem and must ‘share alike’ under the same license as the original.
Are you able to contribute?
To keep these products current, accurate and open, we welcome donations to support <a href='https://doi.org/10.1371/journal.pone.0160640'>associated costs</a>.
I have read and agree to the <a class="button--link" href="https://creativecommons.org/licenses/by-sa/4.0/legalcode" title='View the Licence Terms and Conditions' target='_blank'>Licence Terms and Conditions</a>
Citation
Citation: UNEP-WCMC. (2020). Human pressures on biodiversity, water and carbon. Cambridge, UK: UNEP-WCMC. https://doi.org/10.34892/ykjb-c787
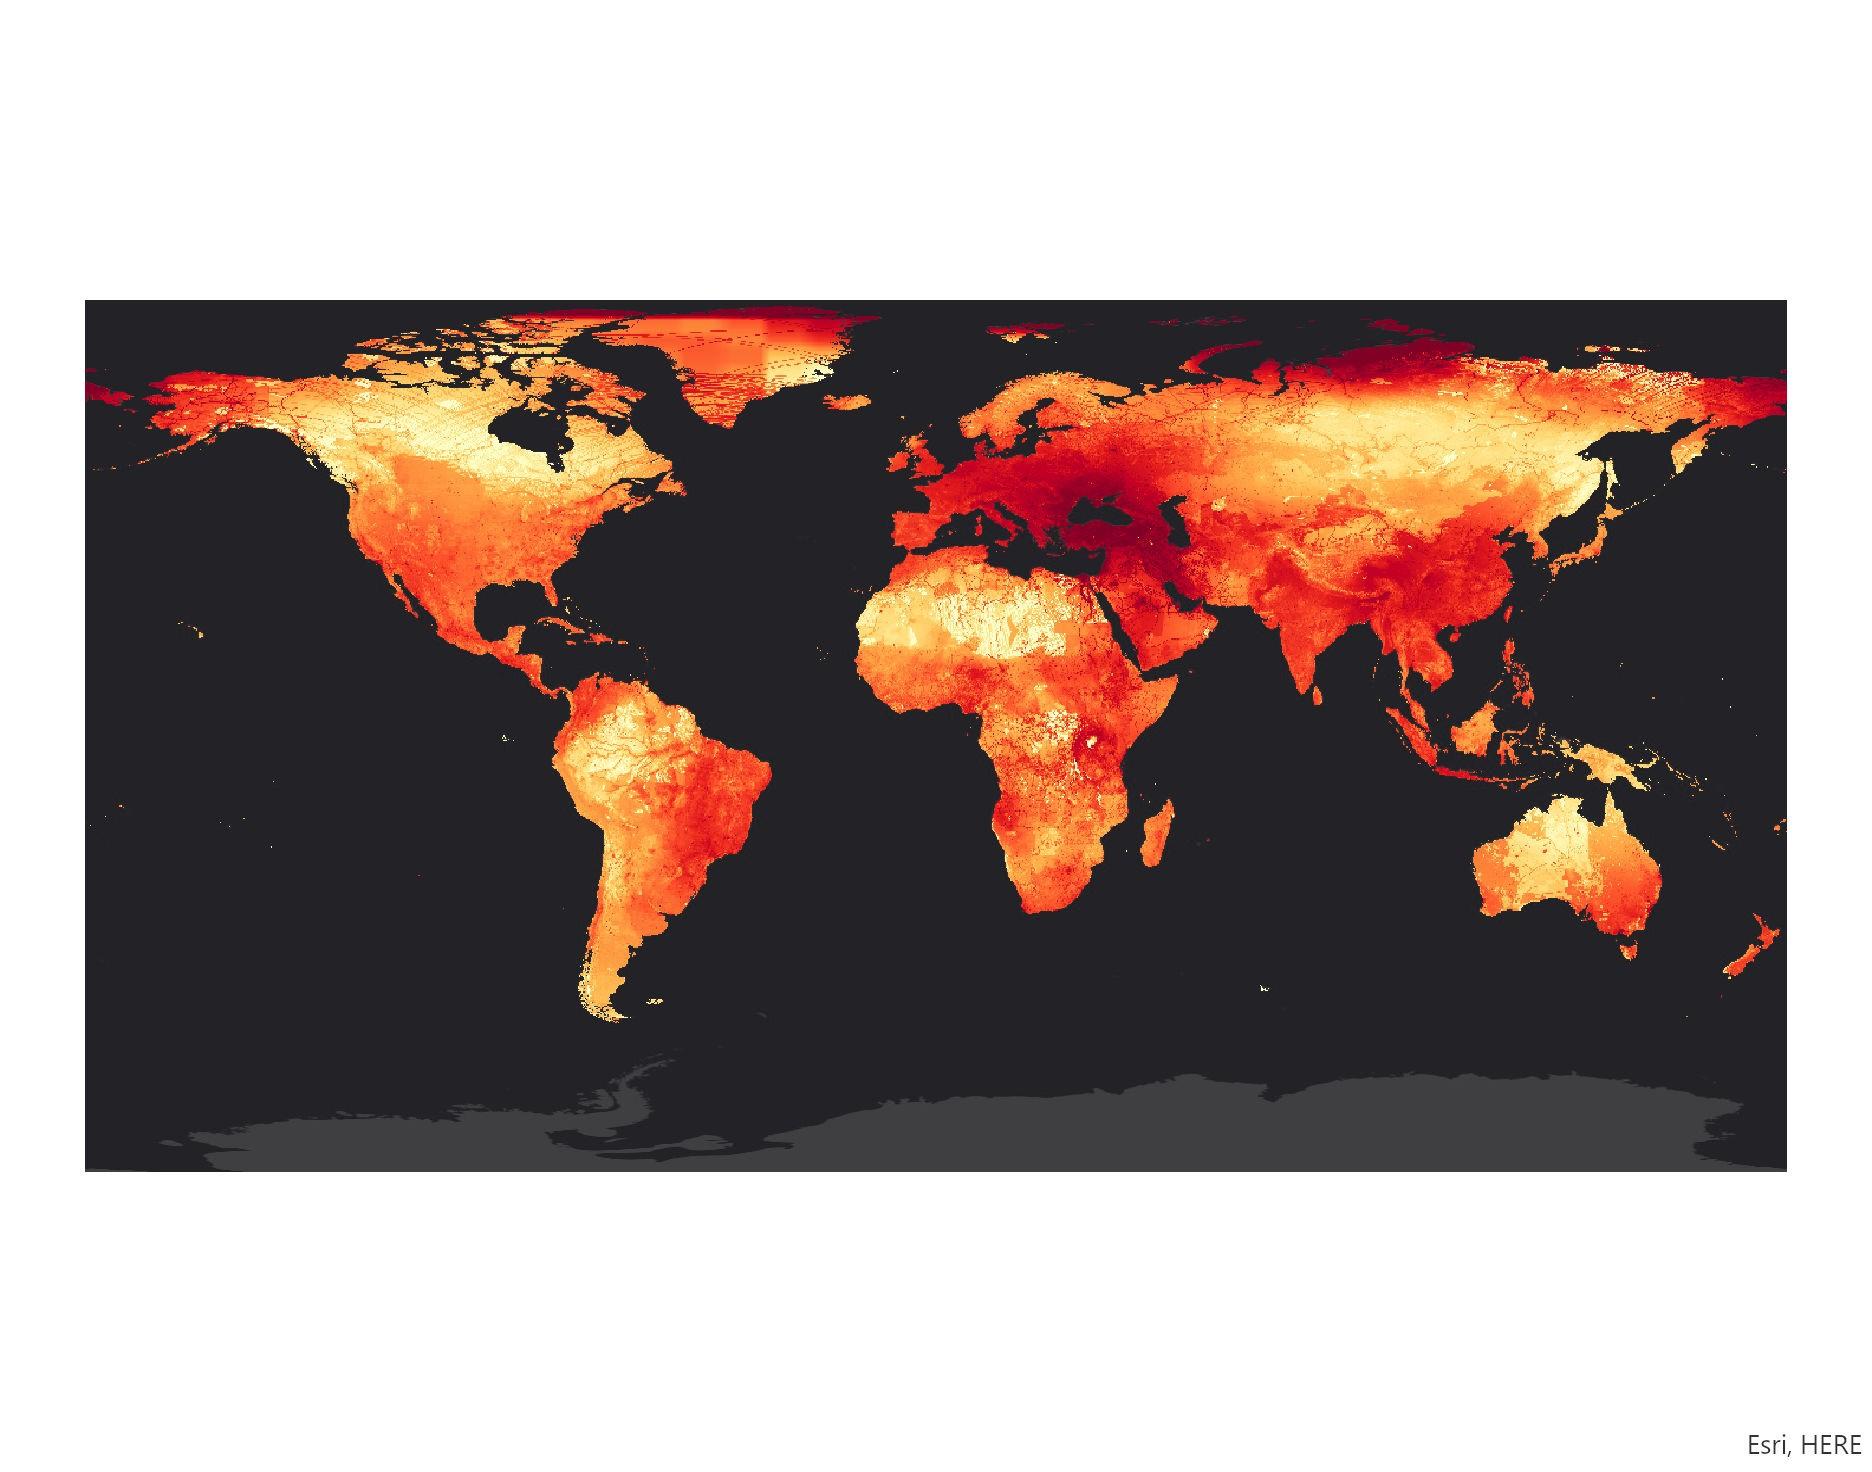
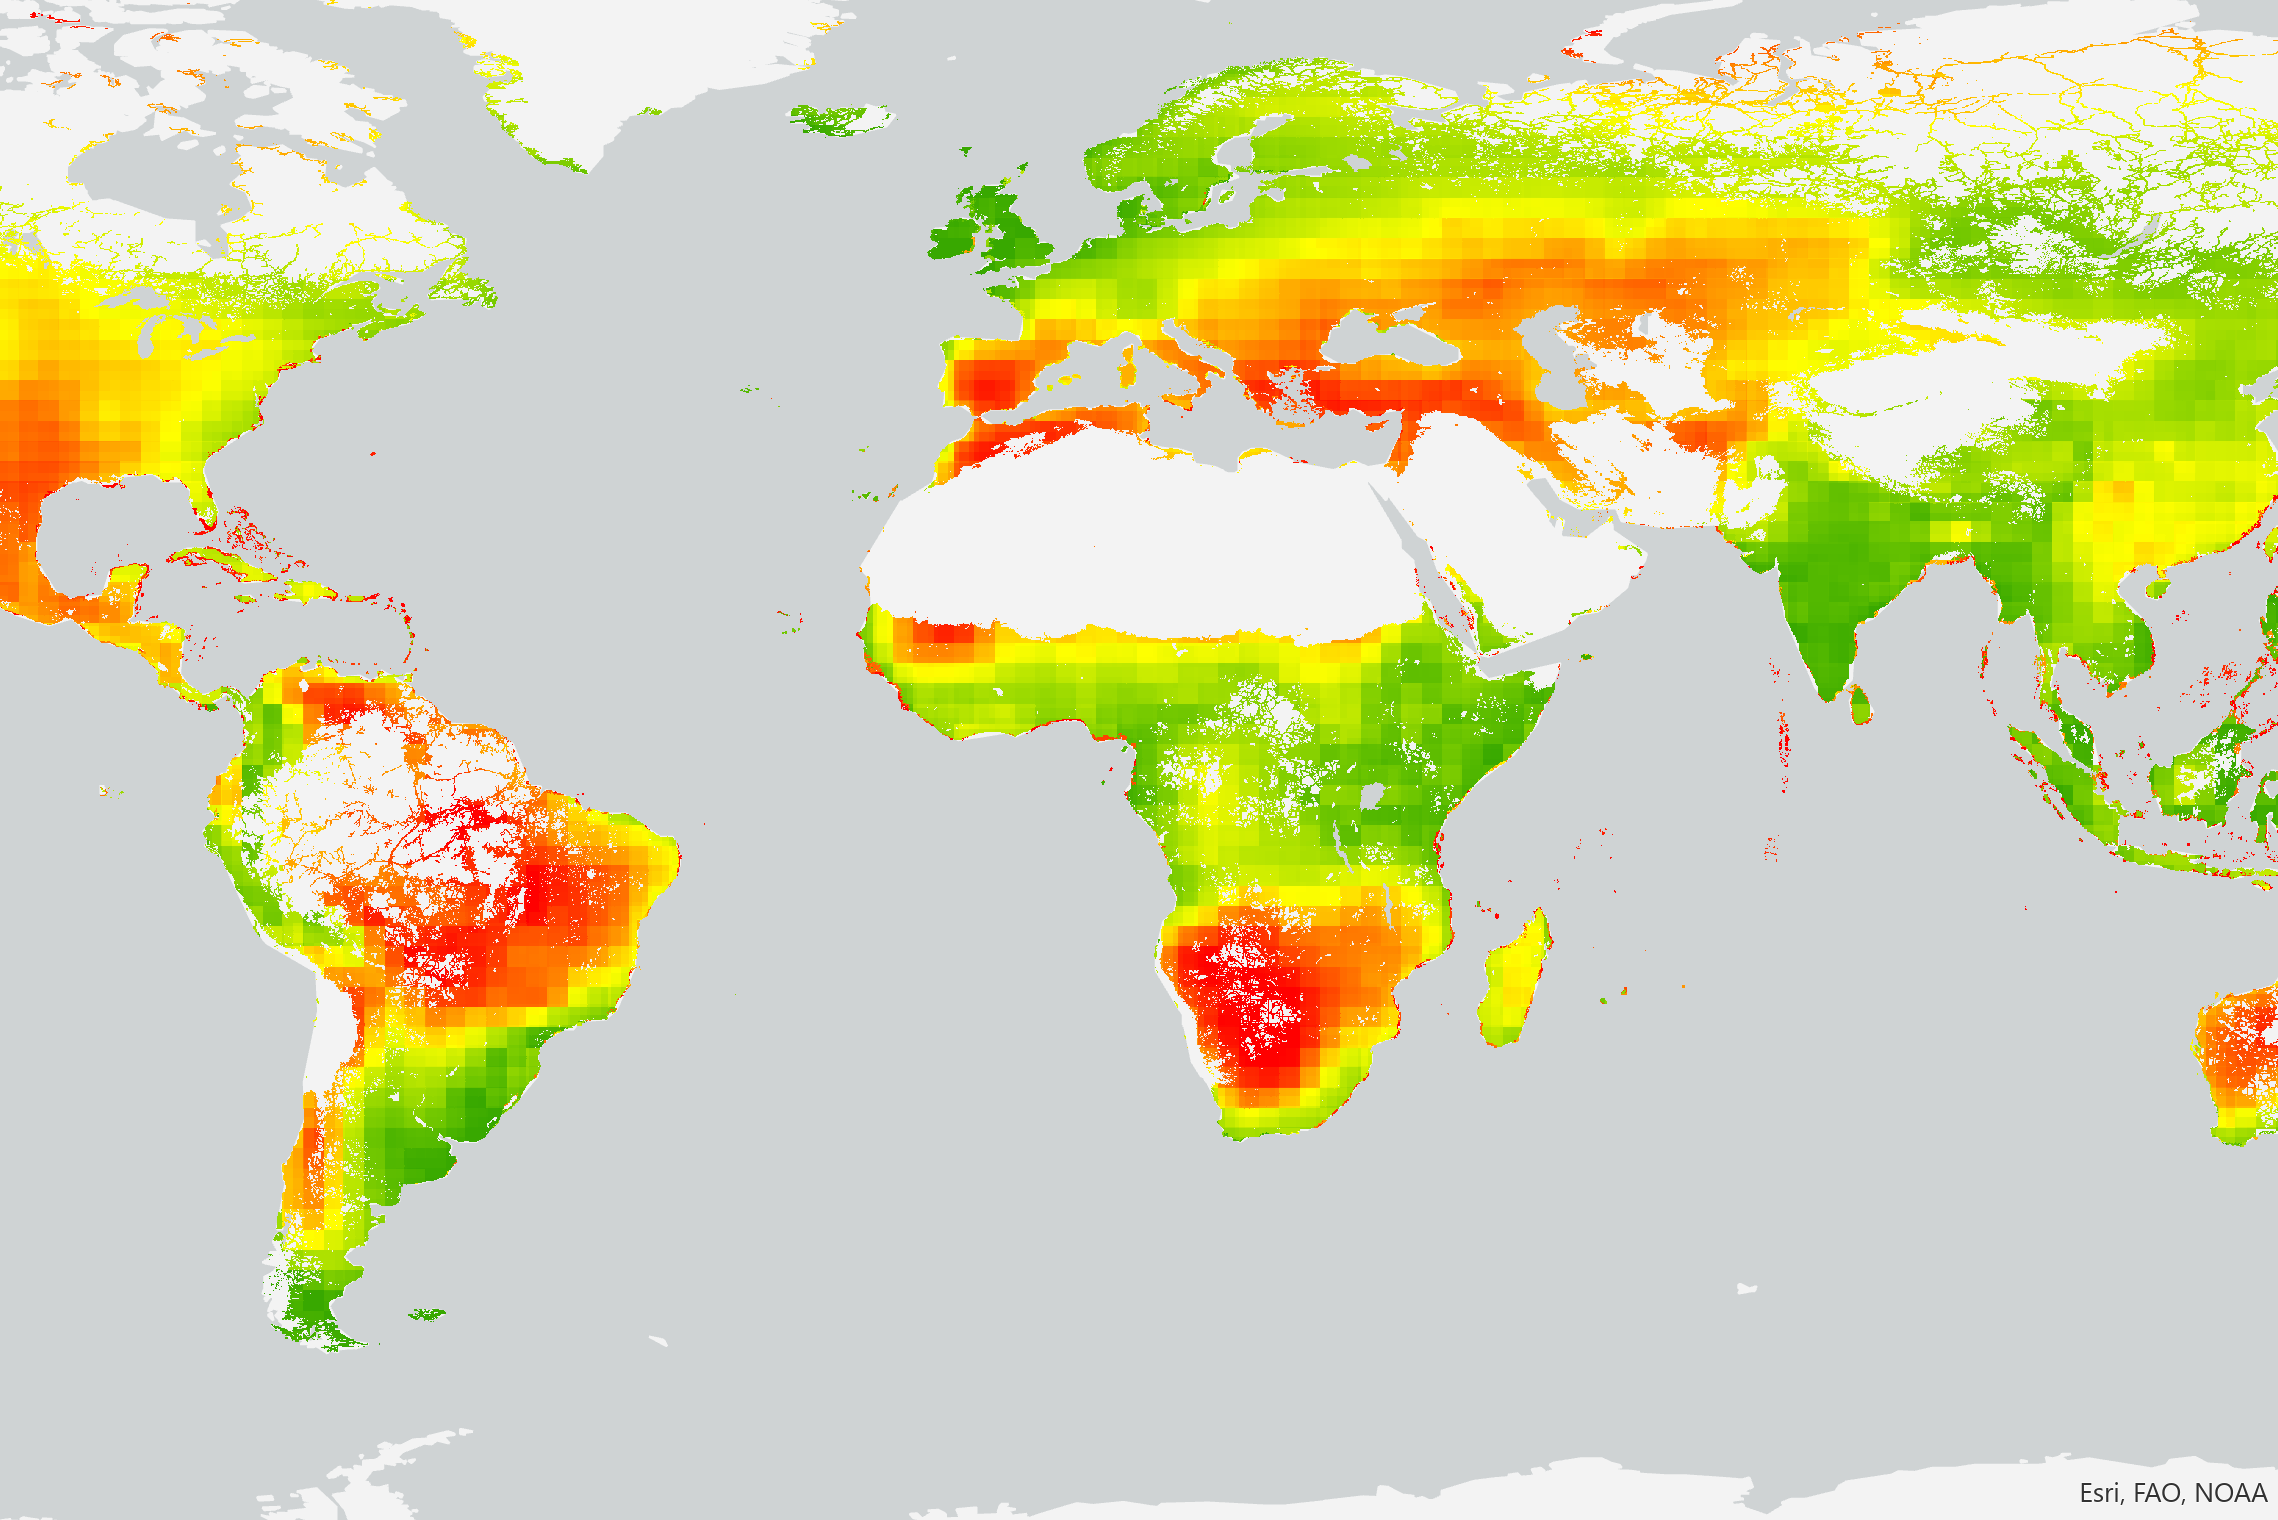
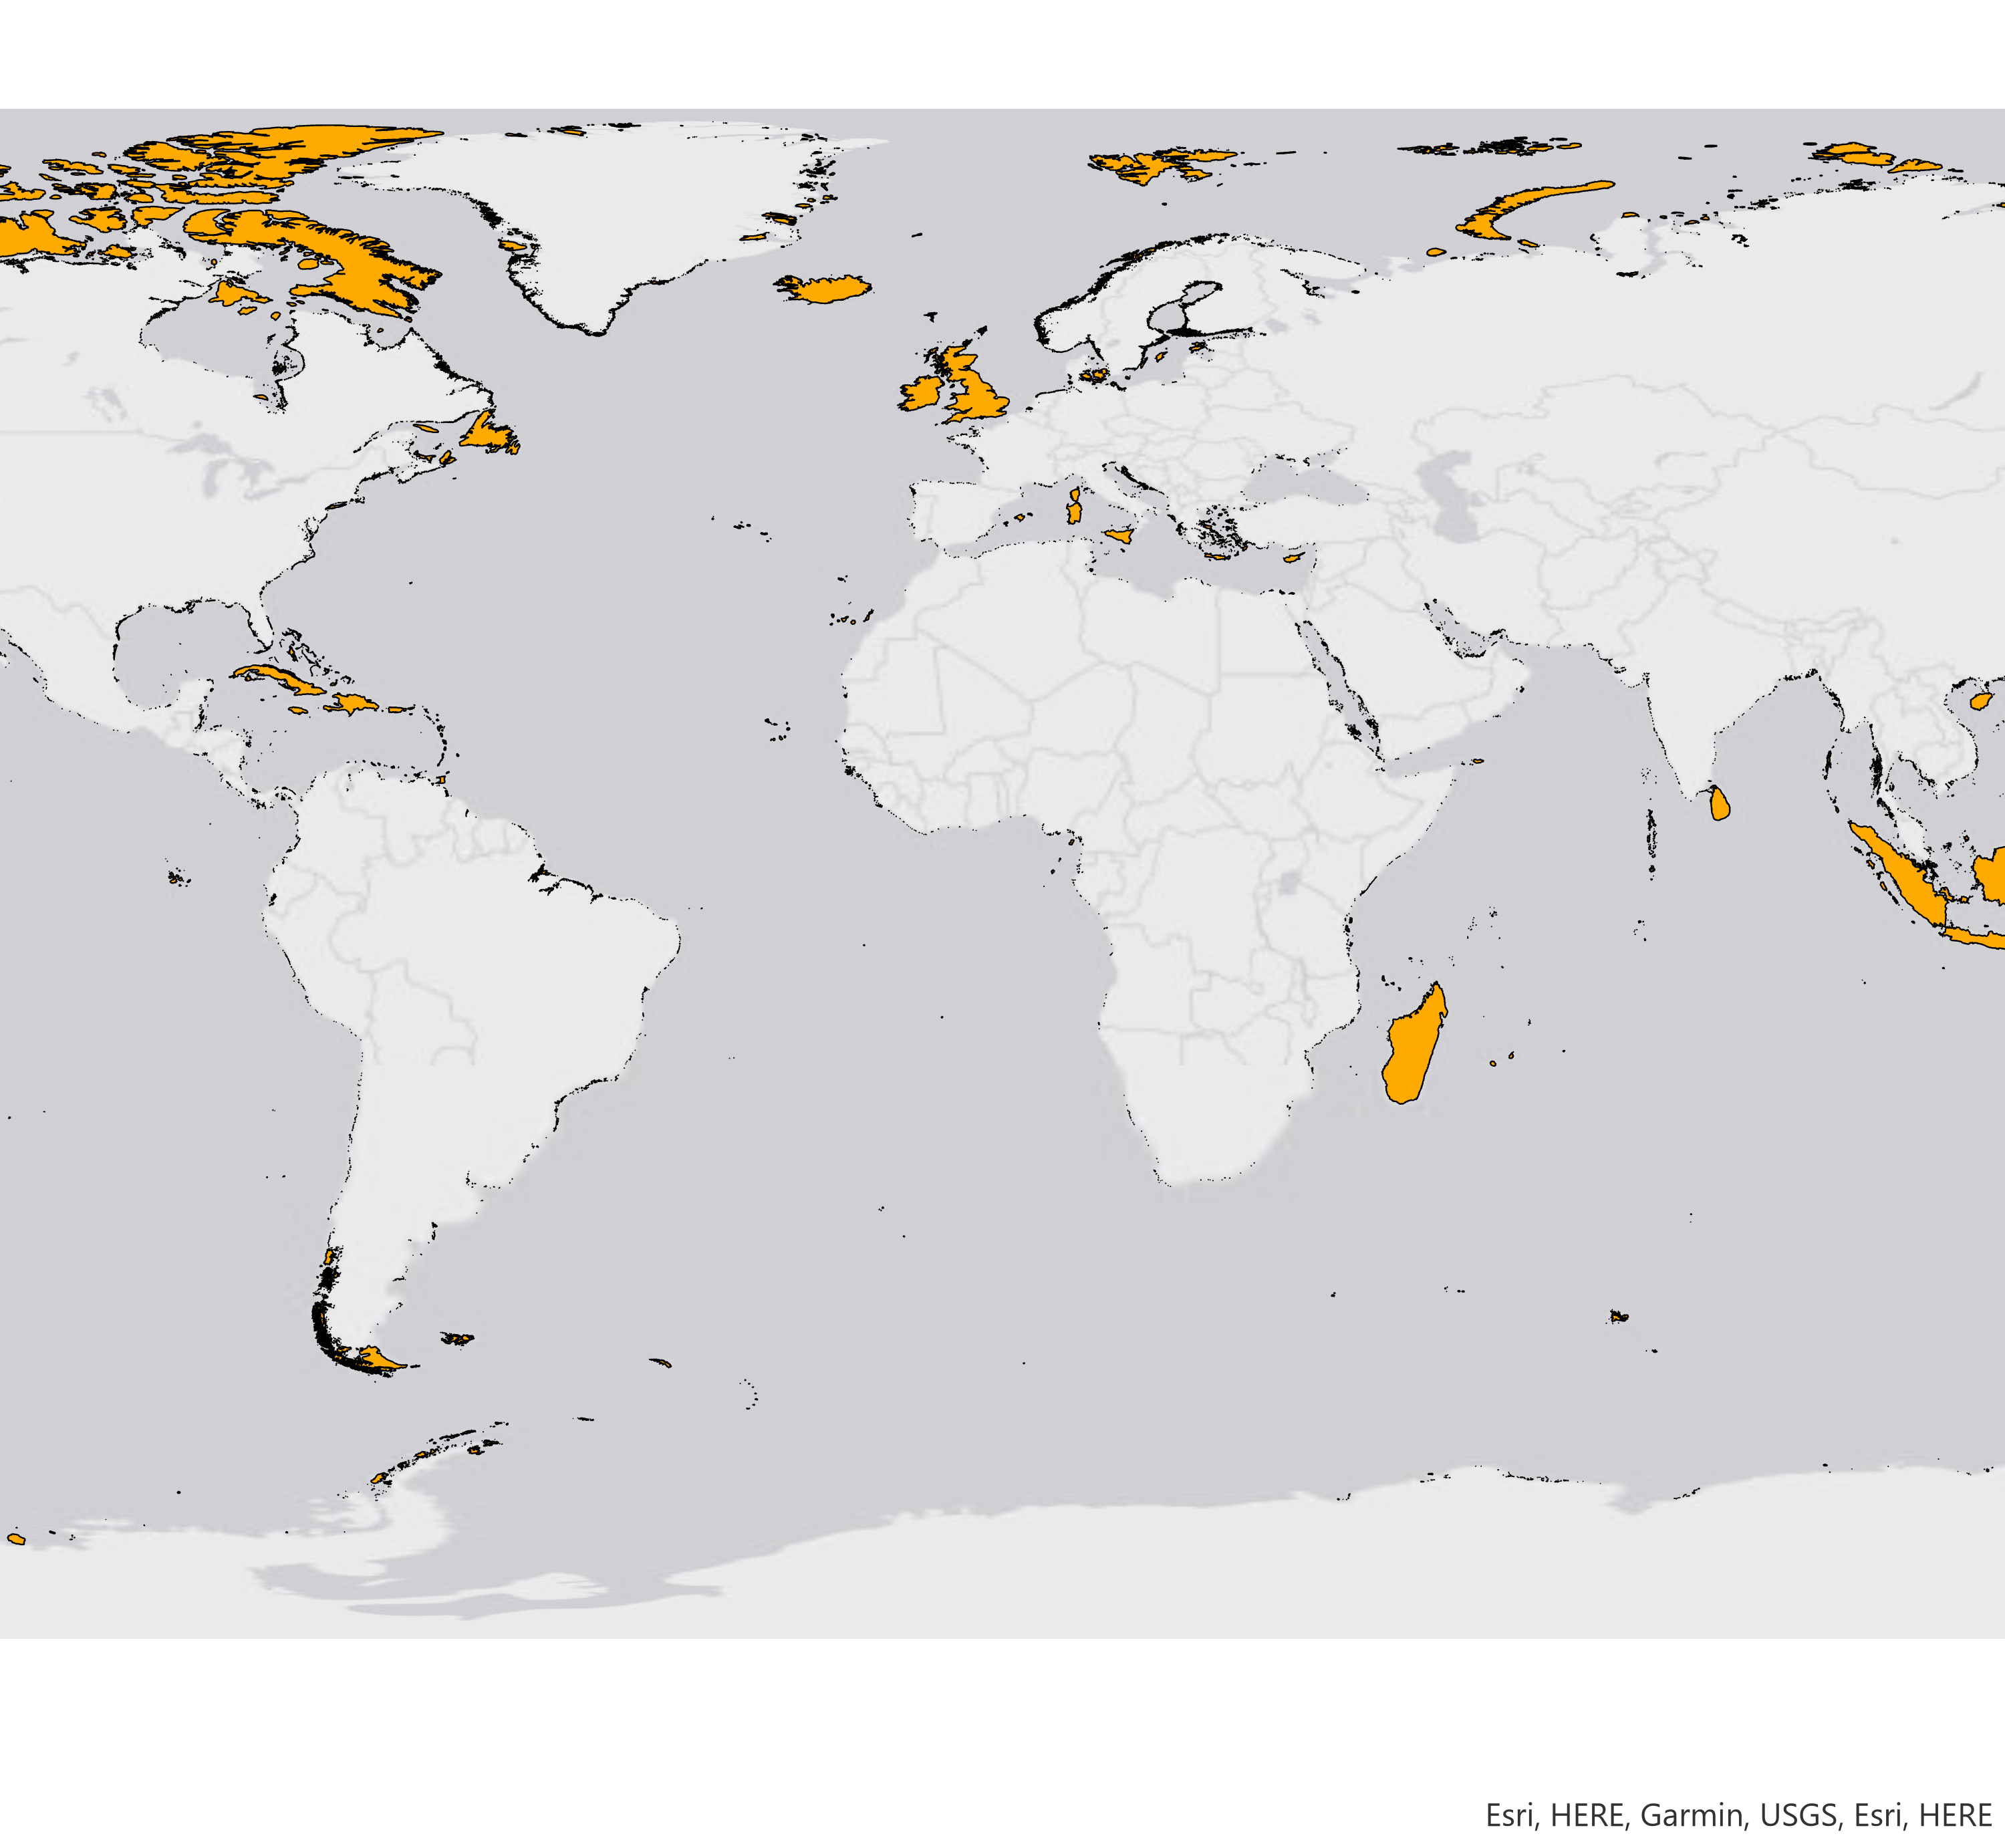
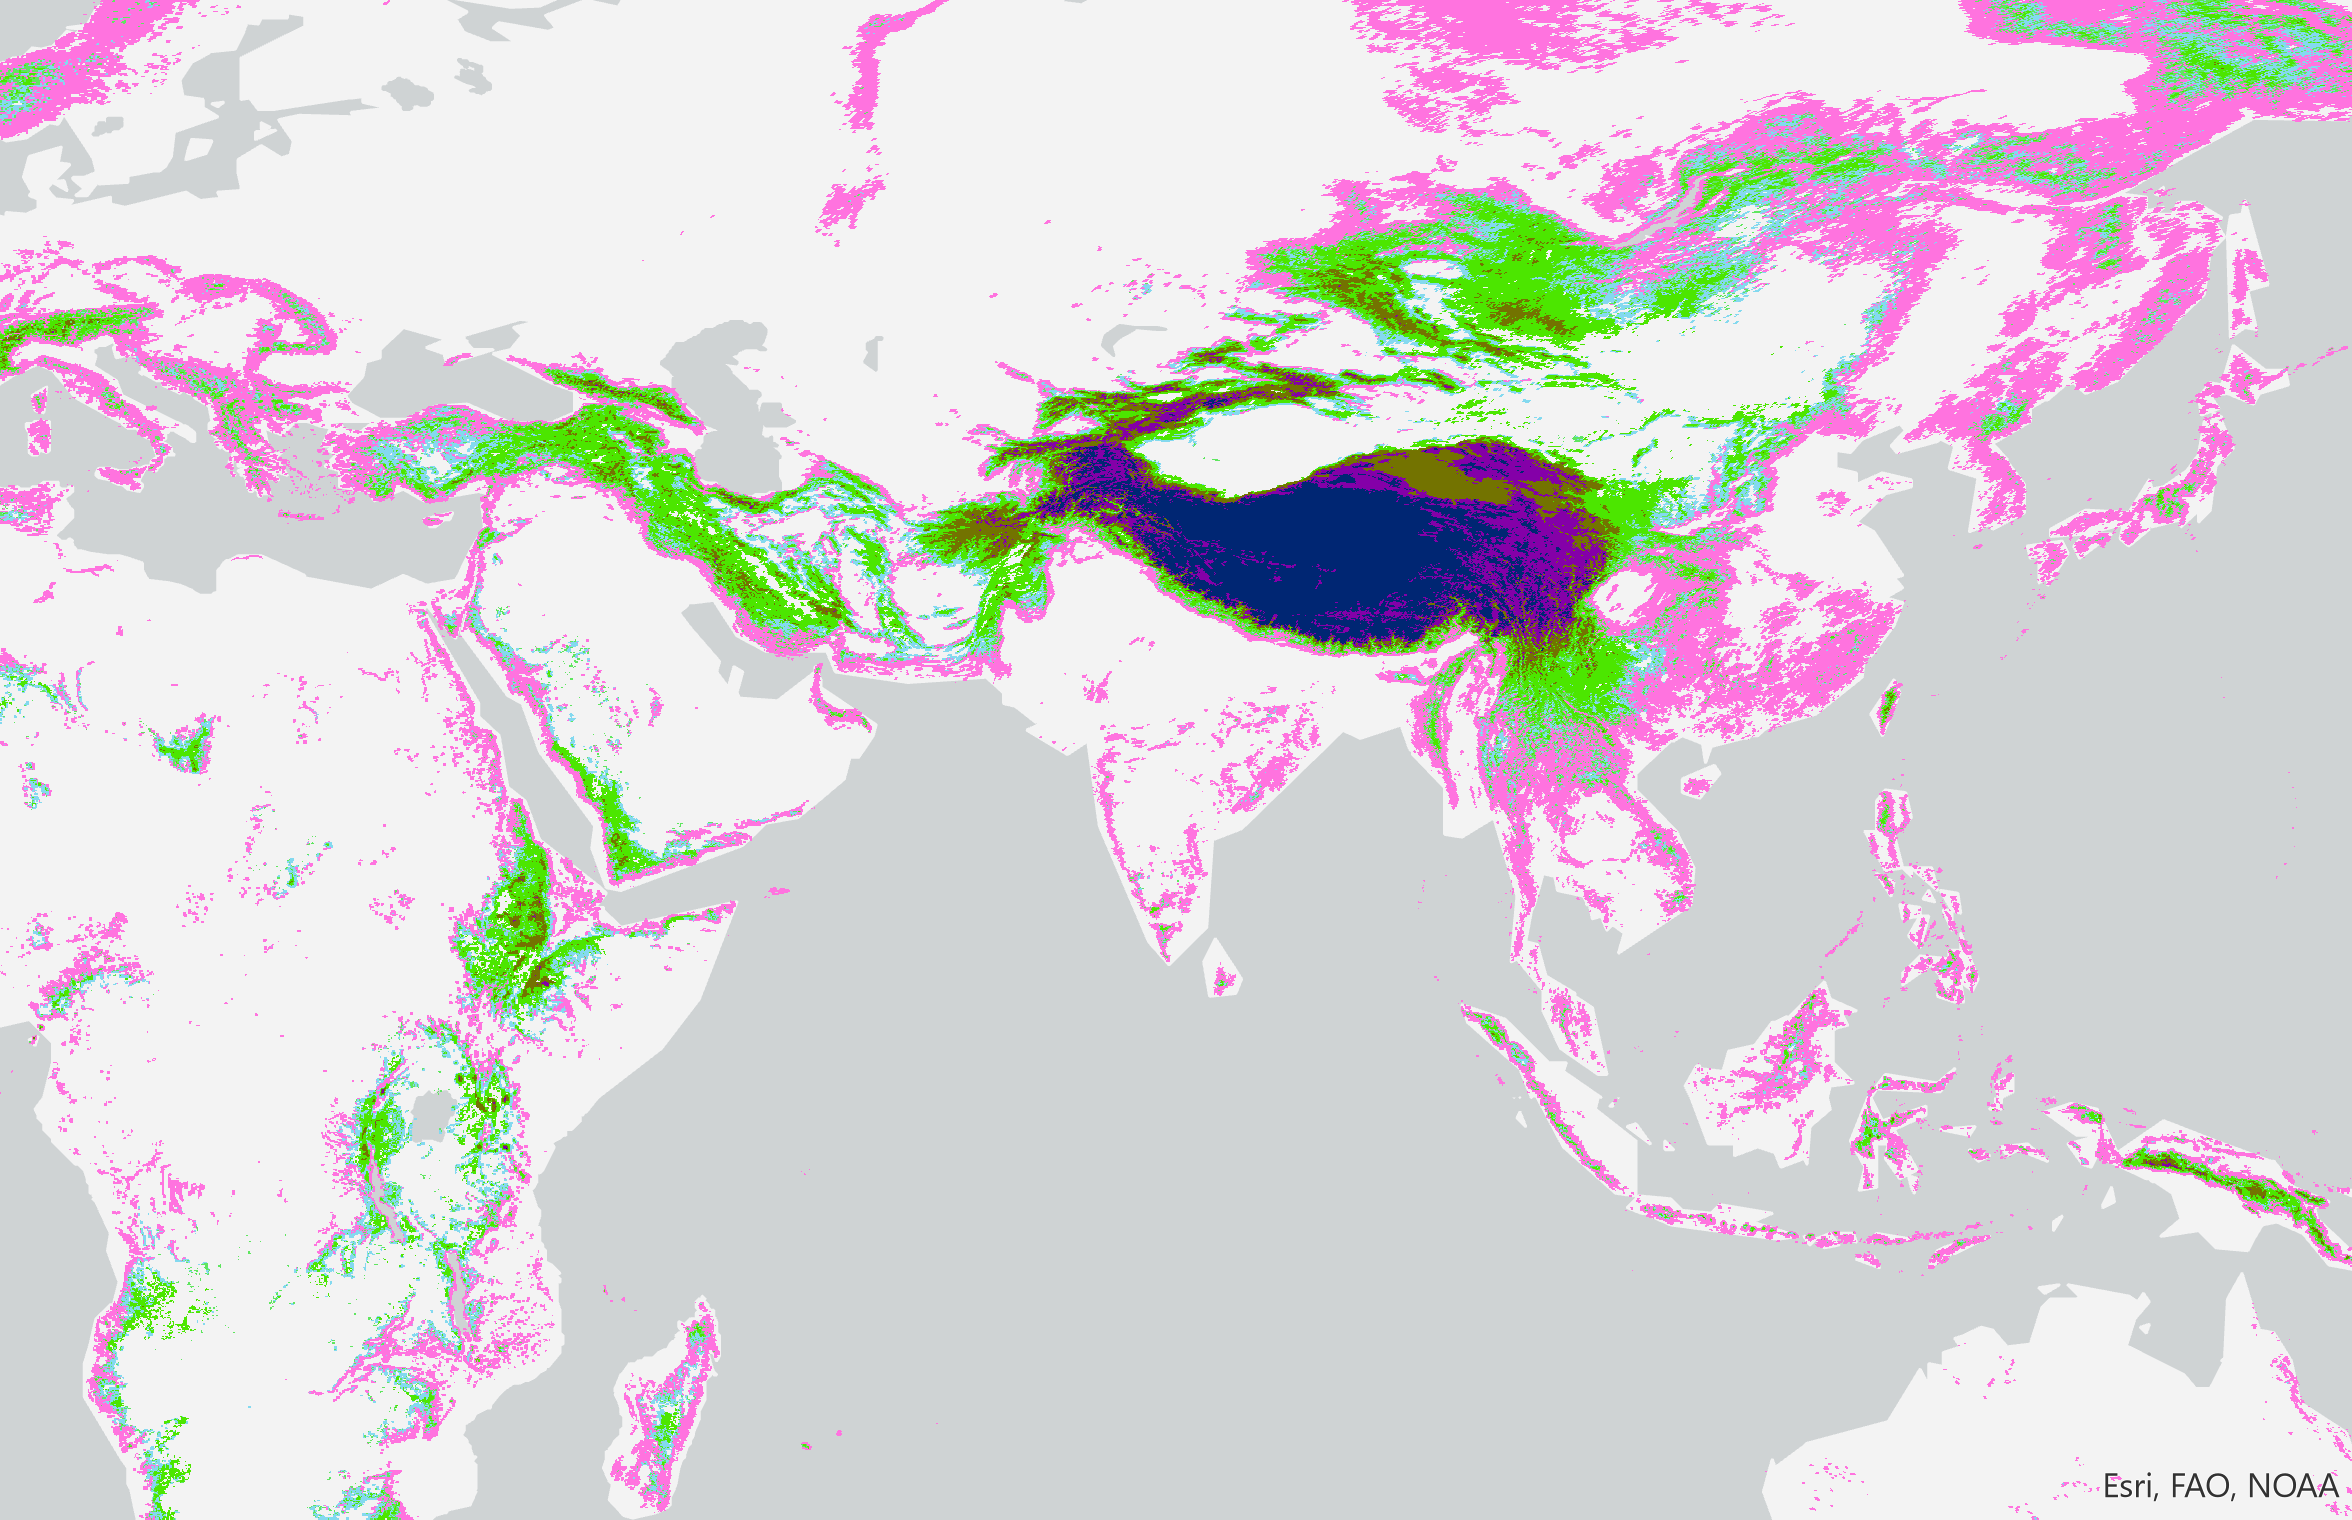
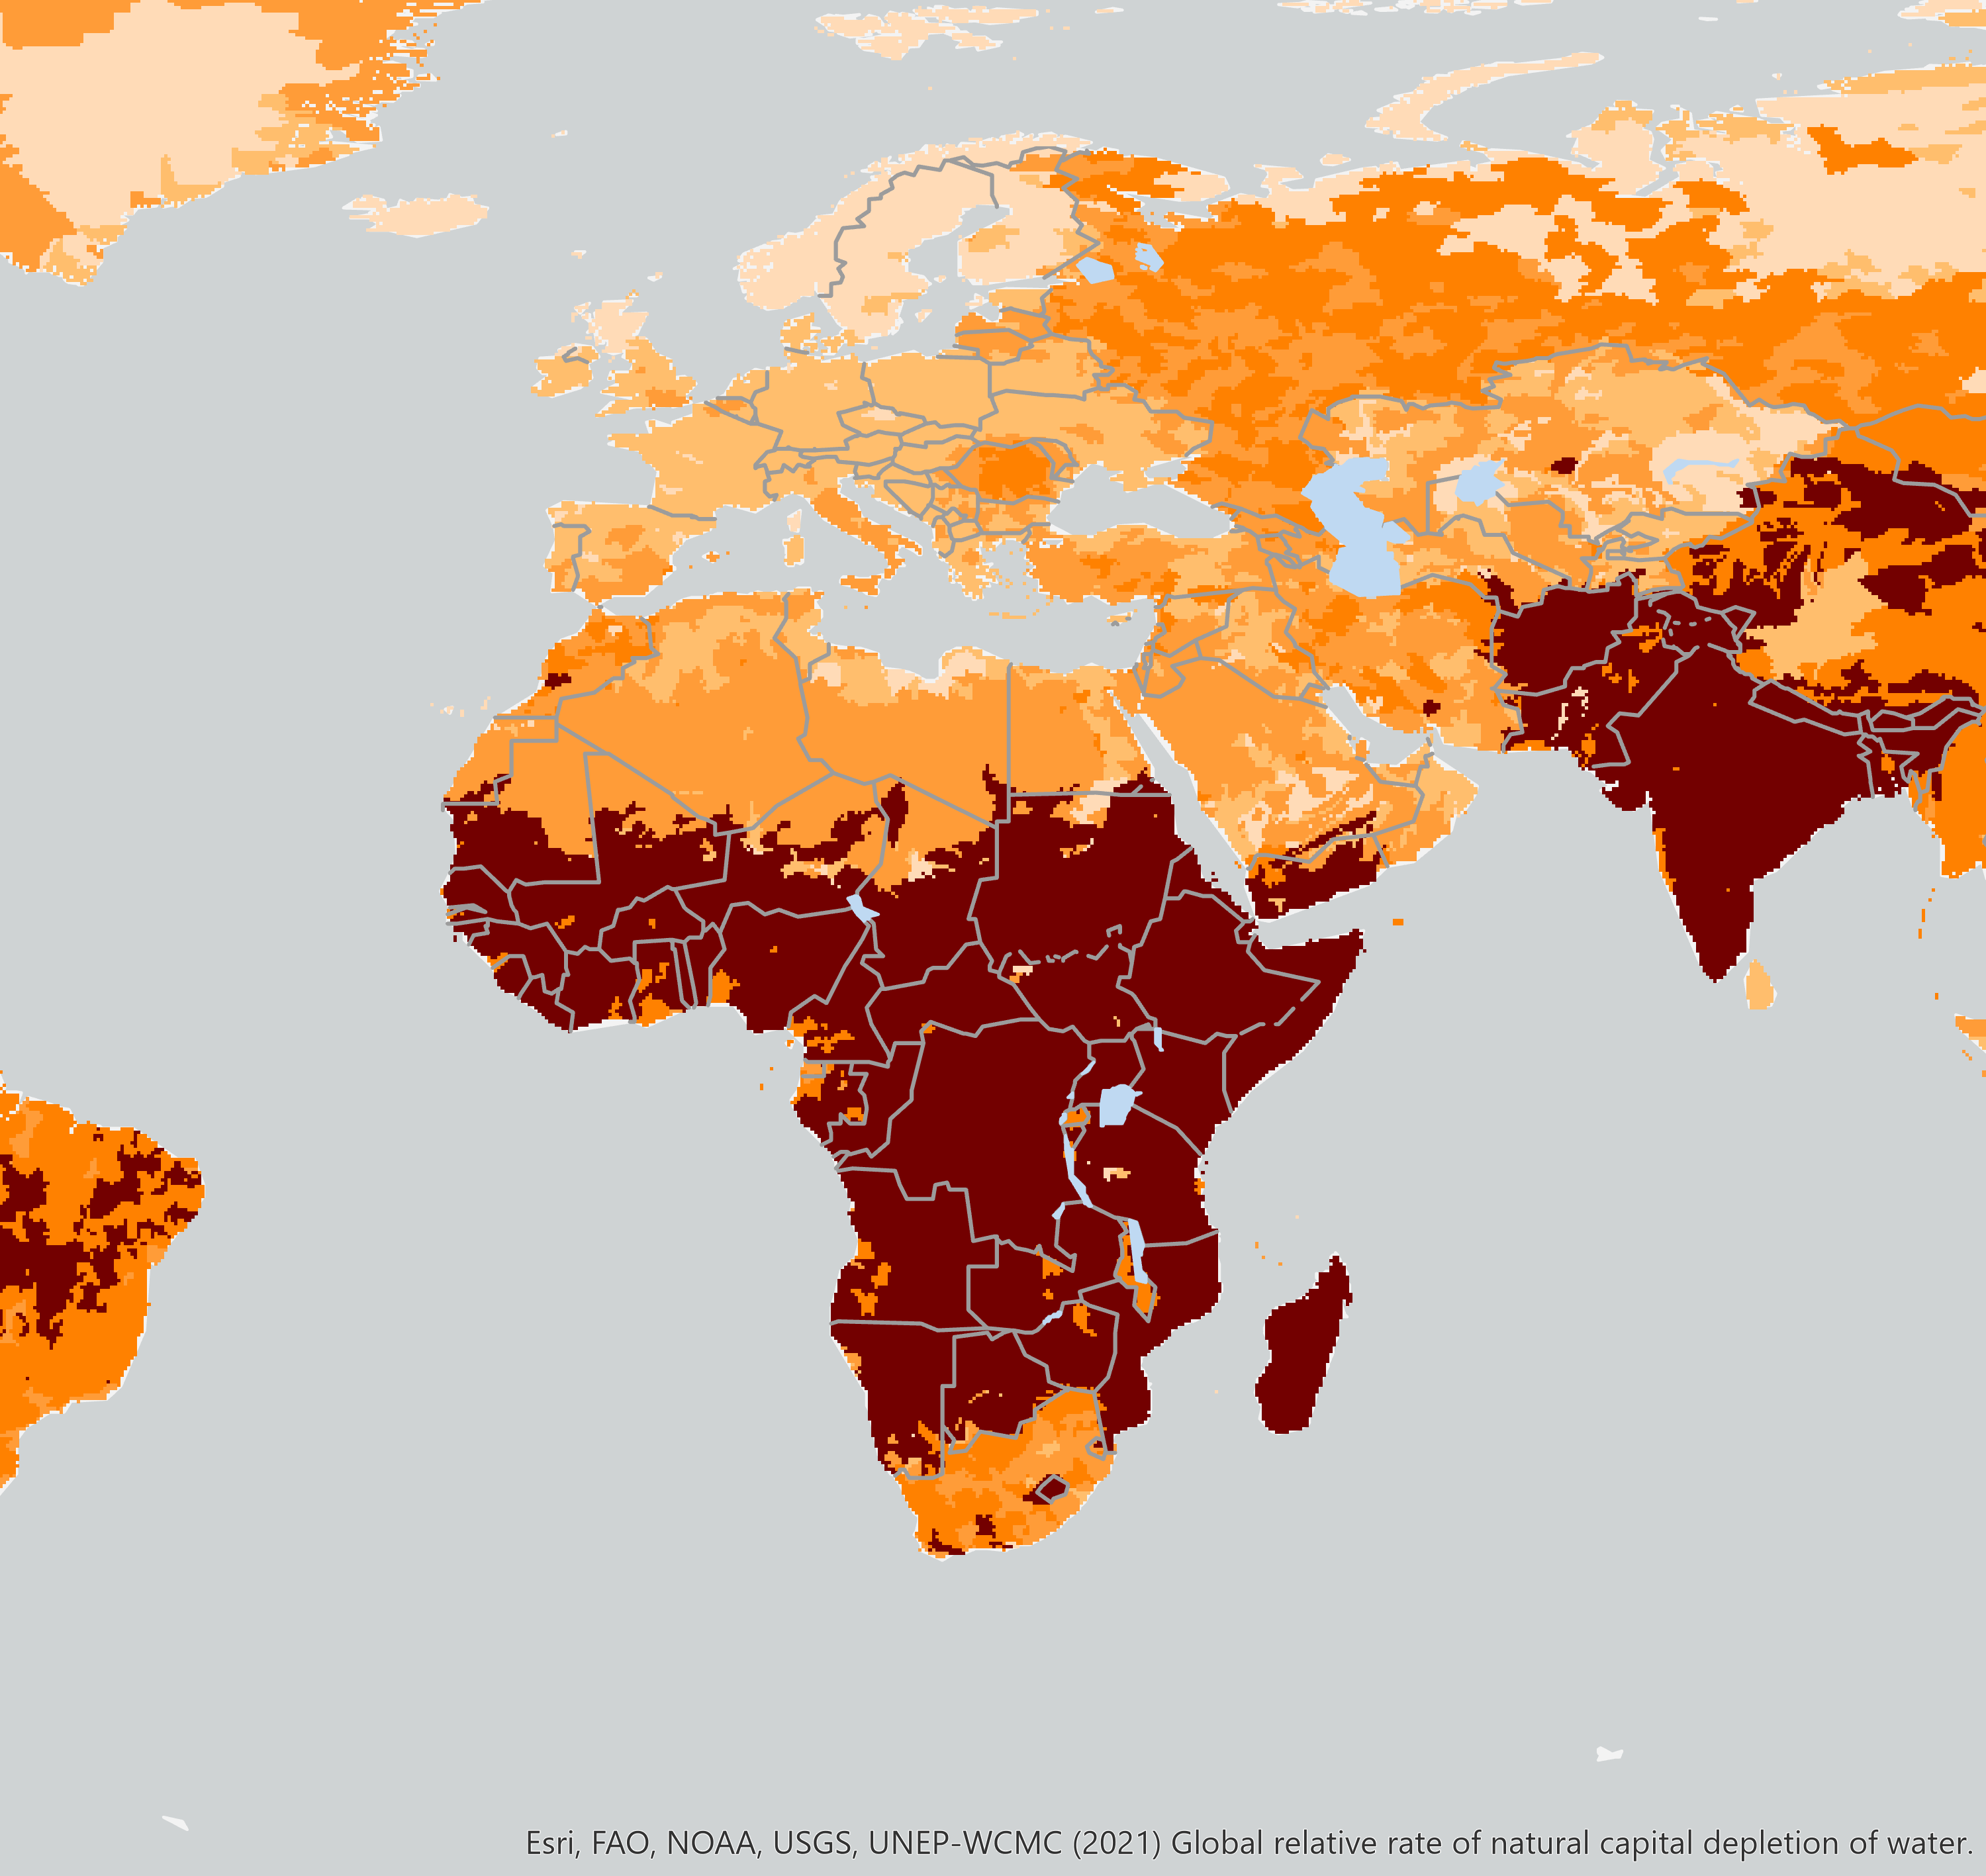
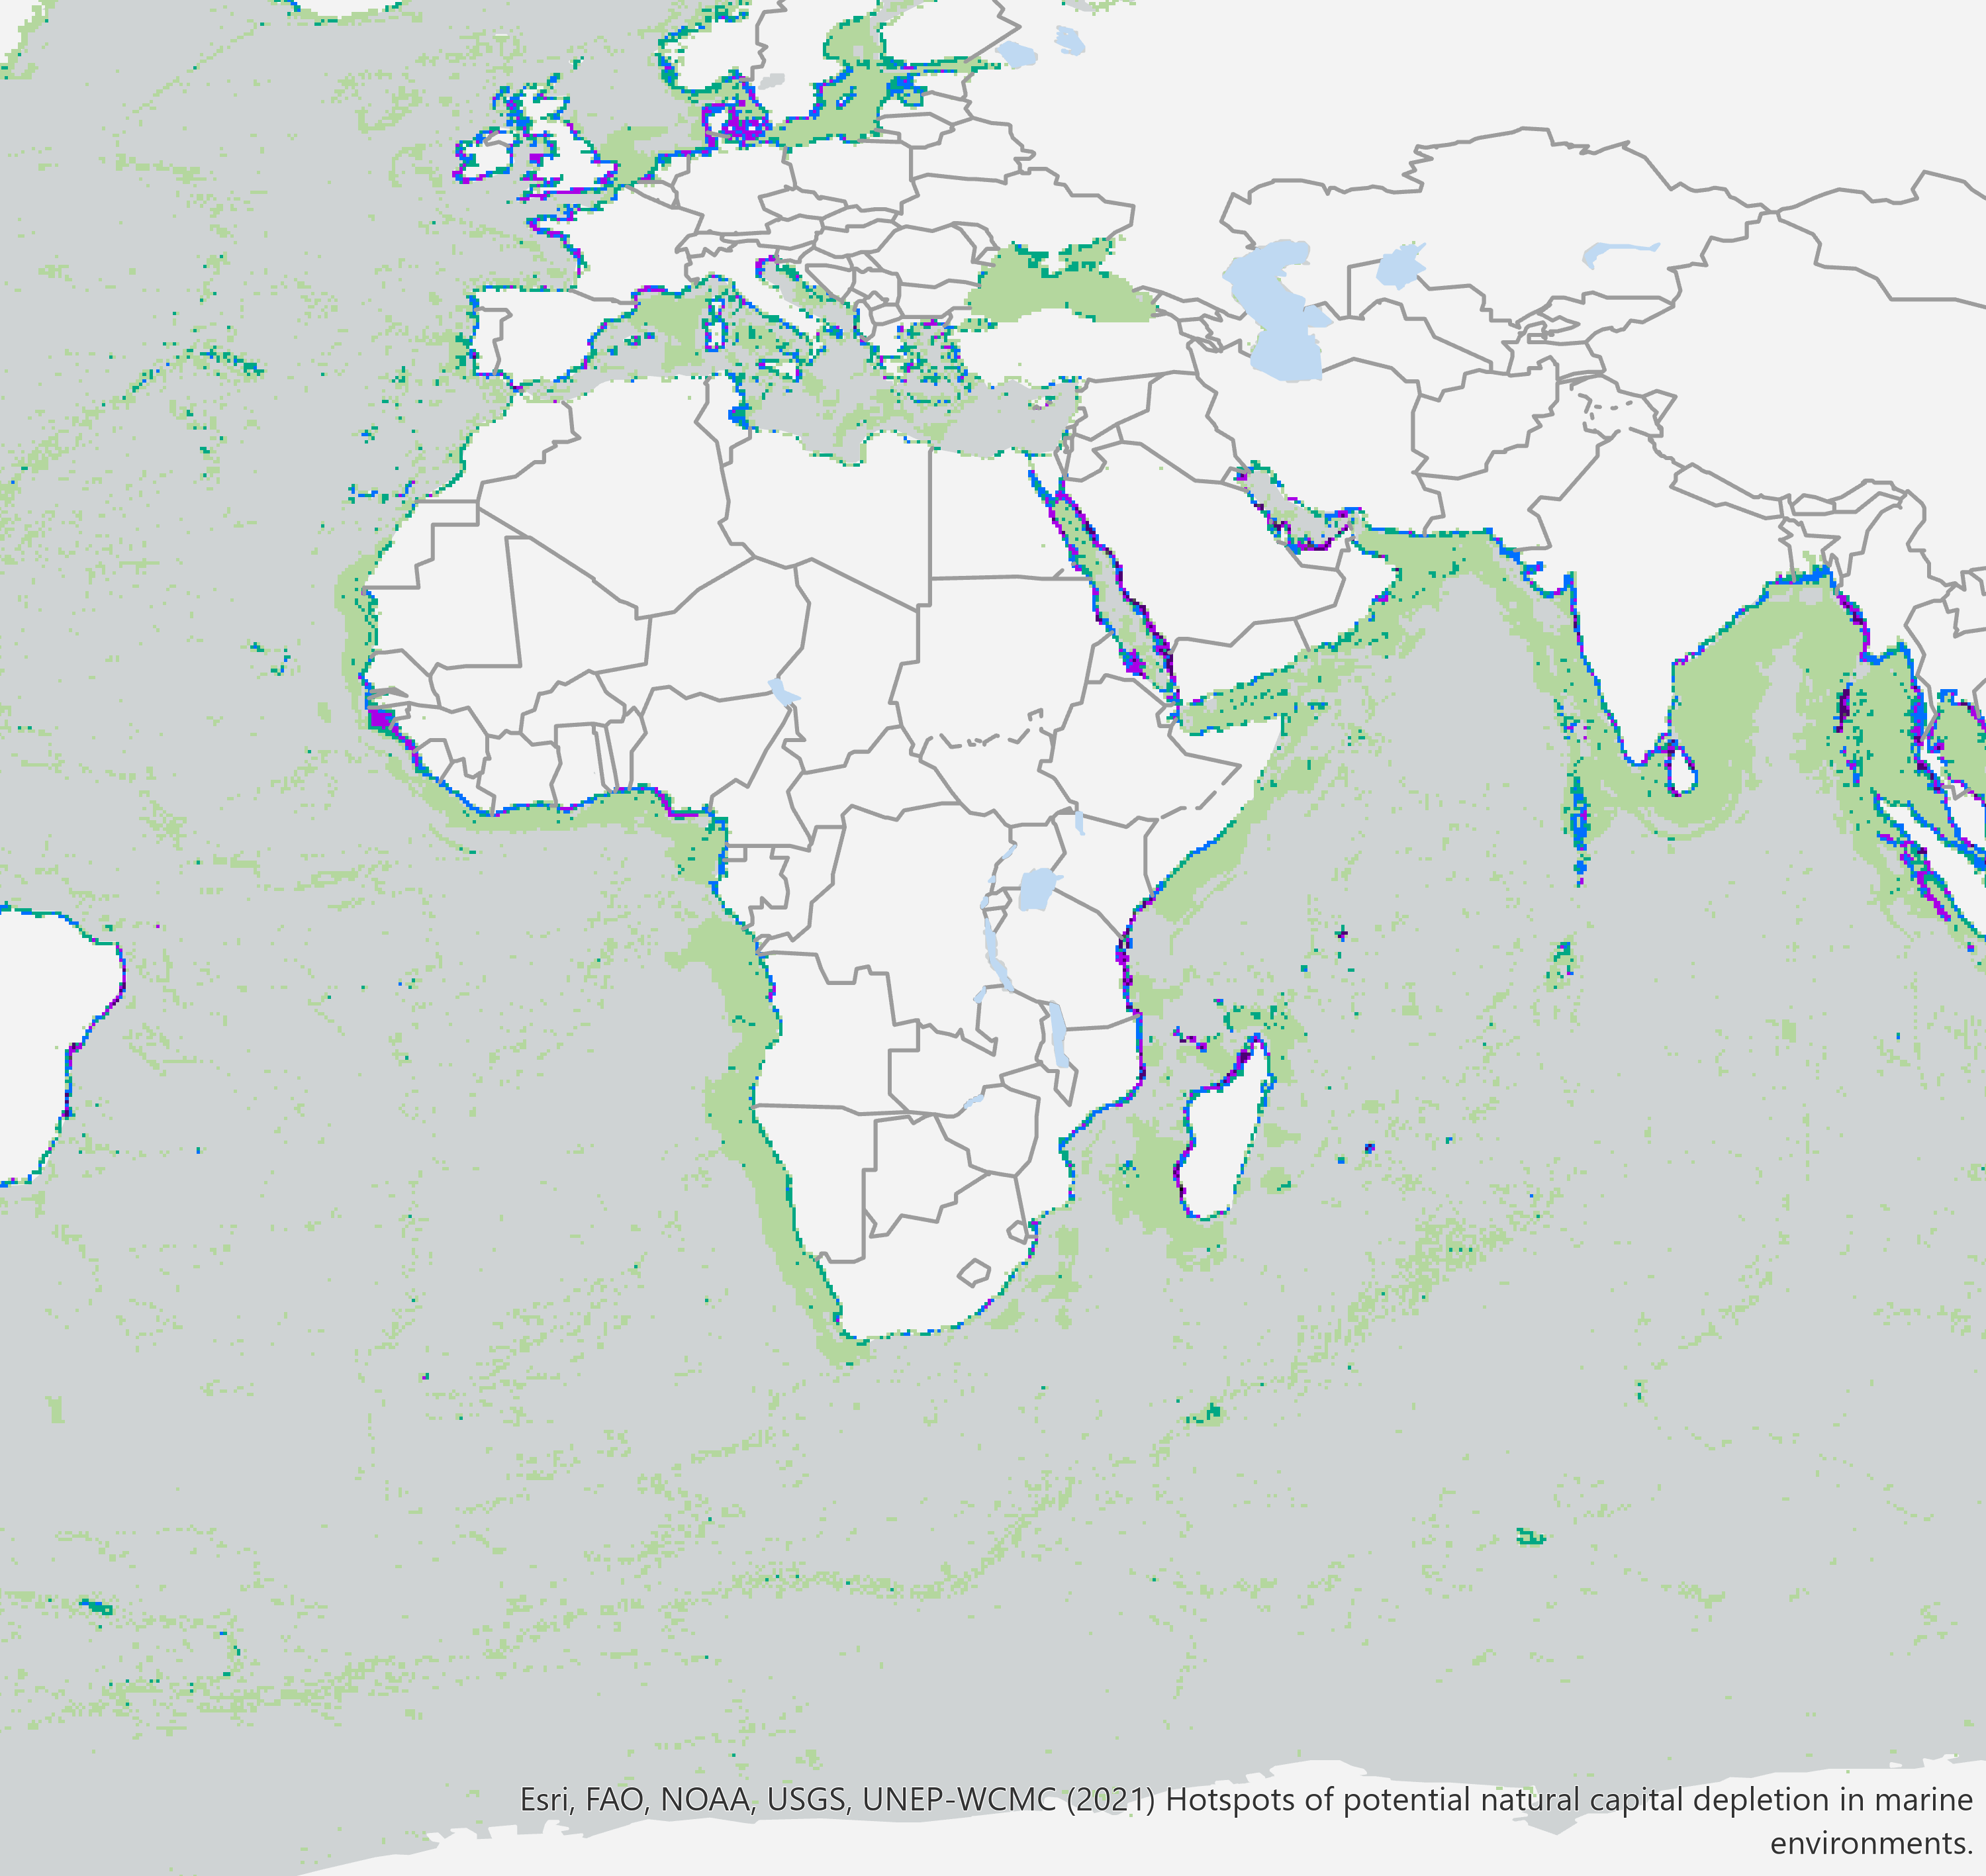
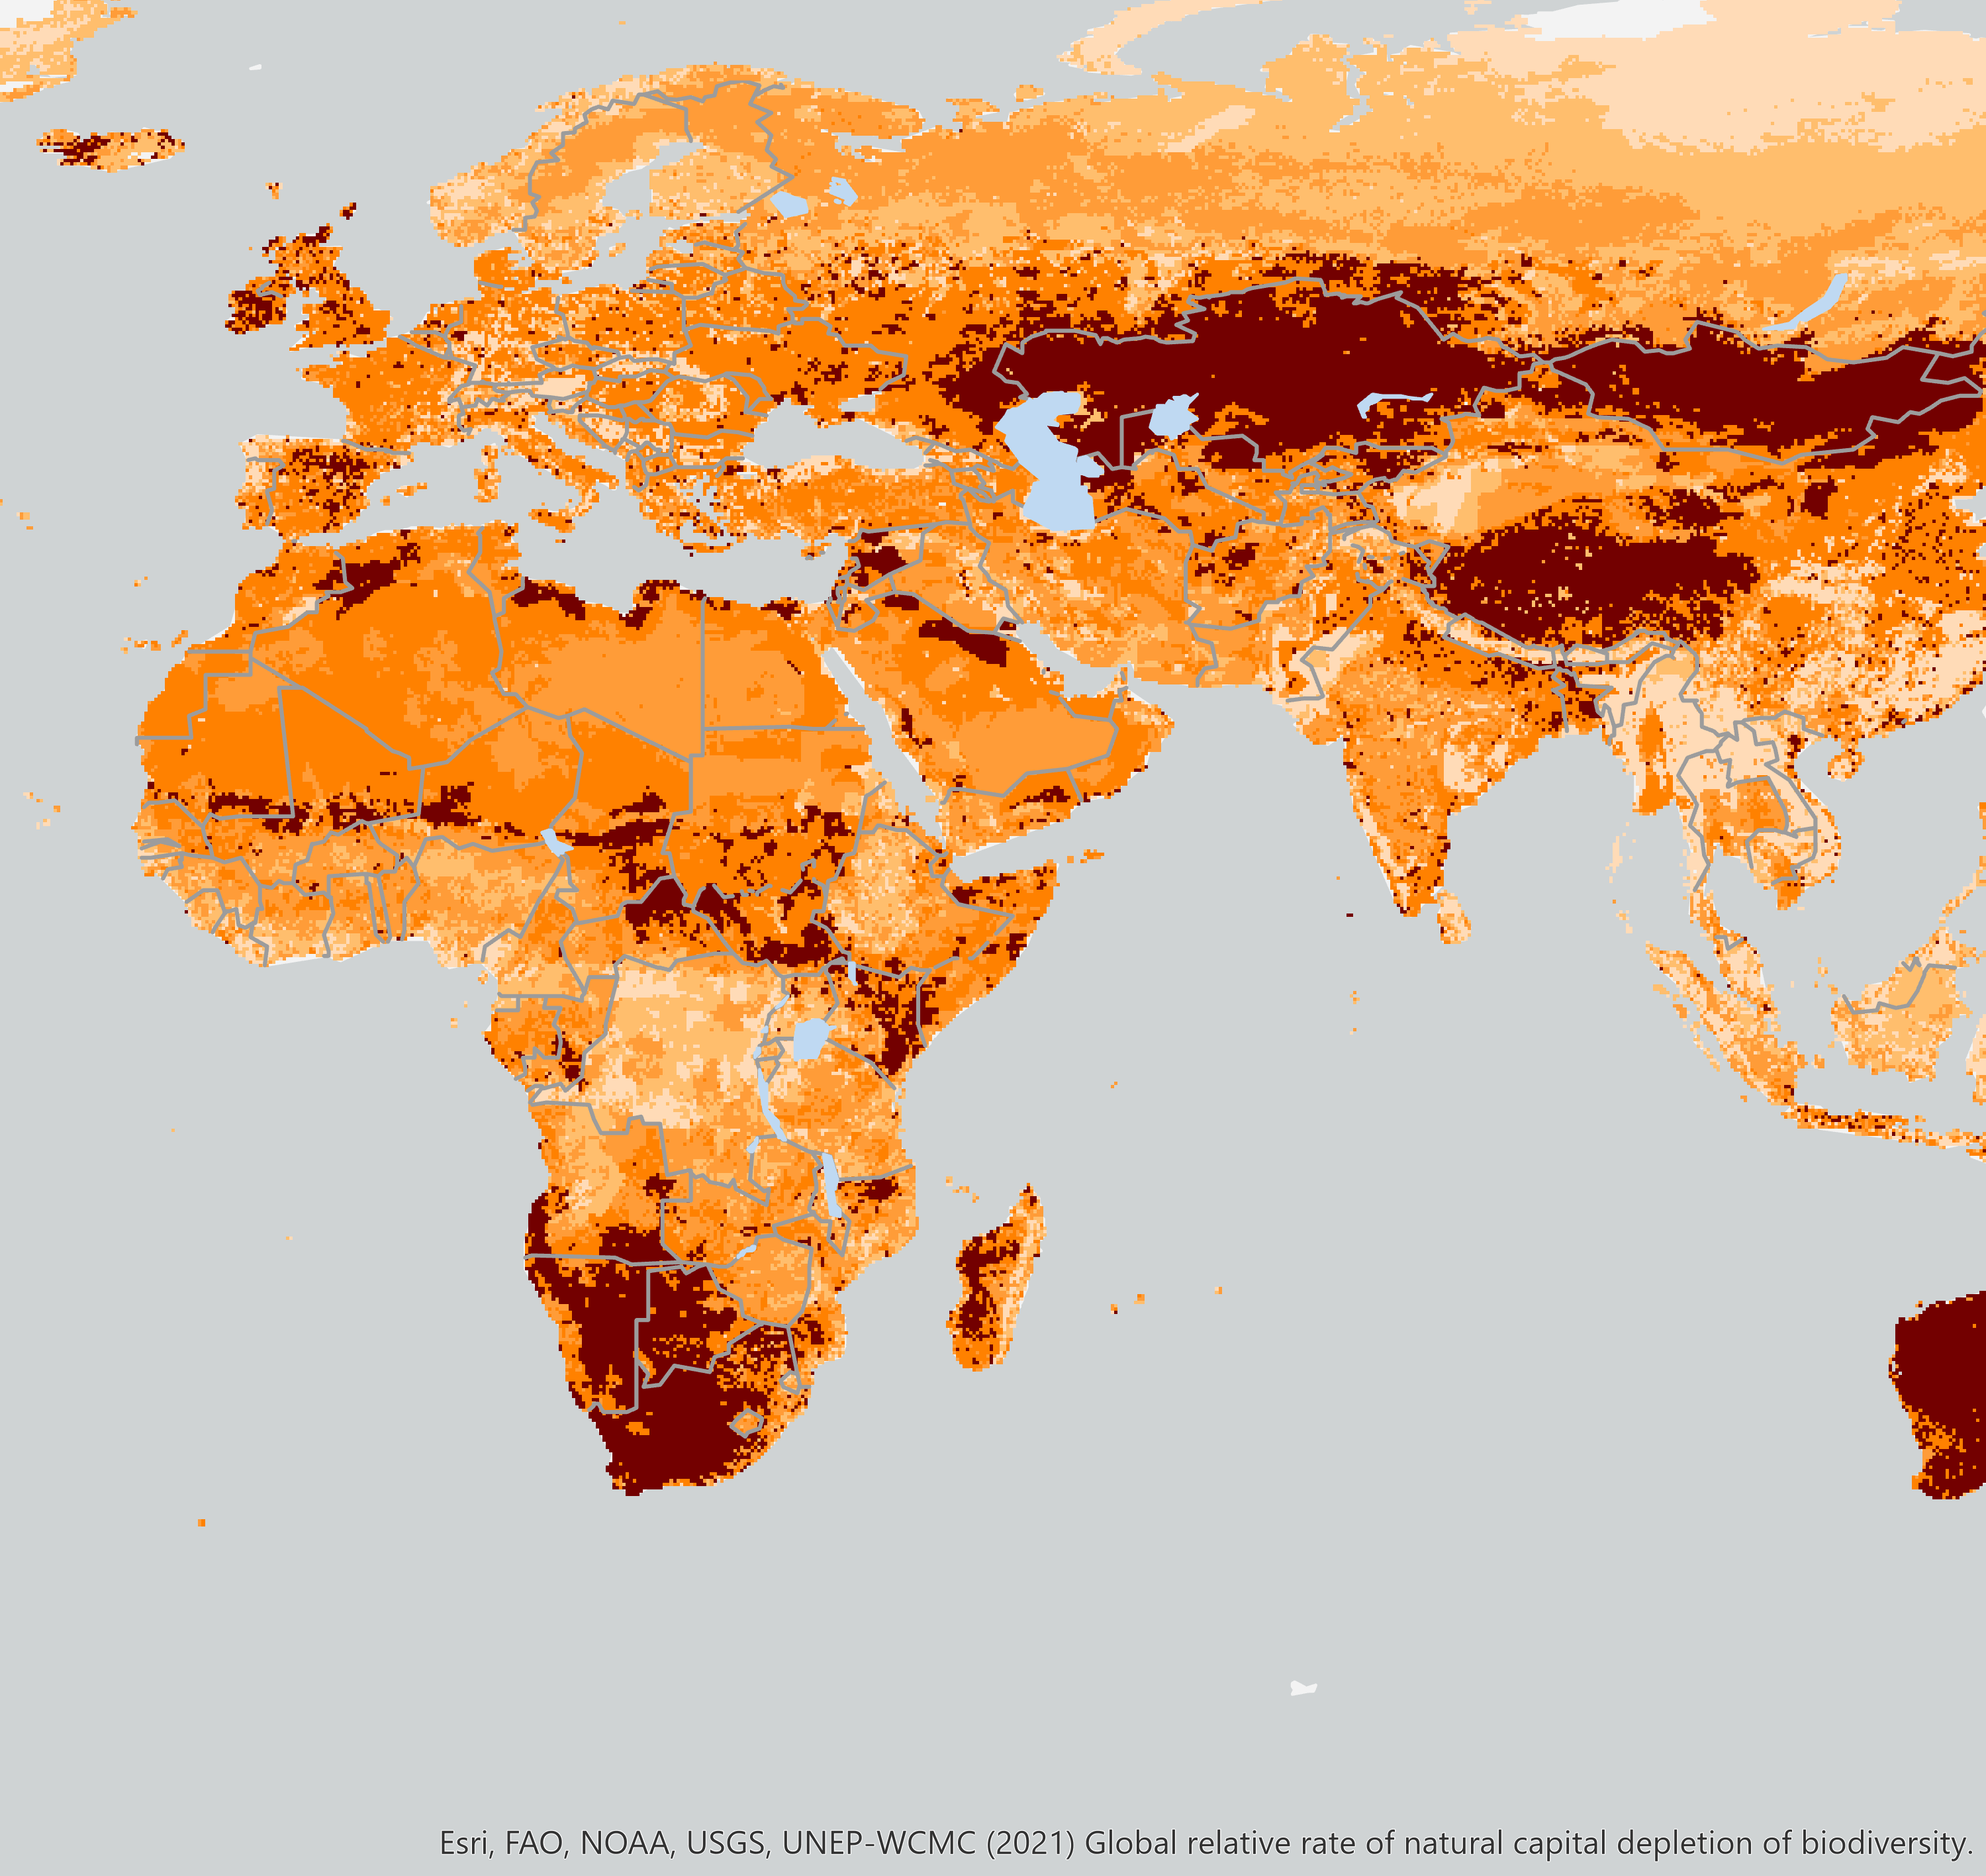
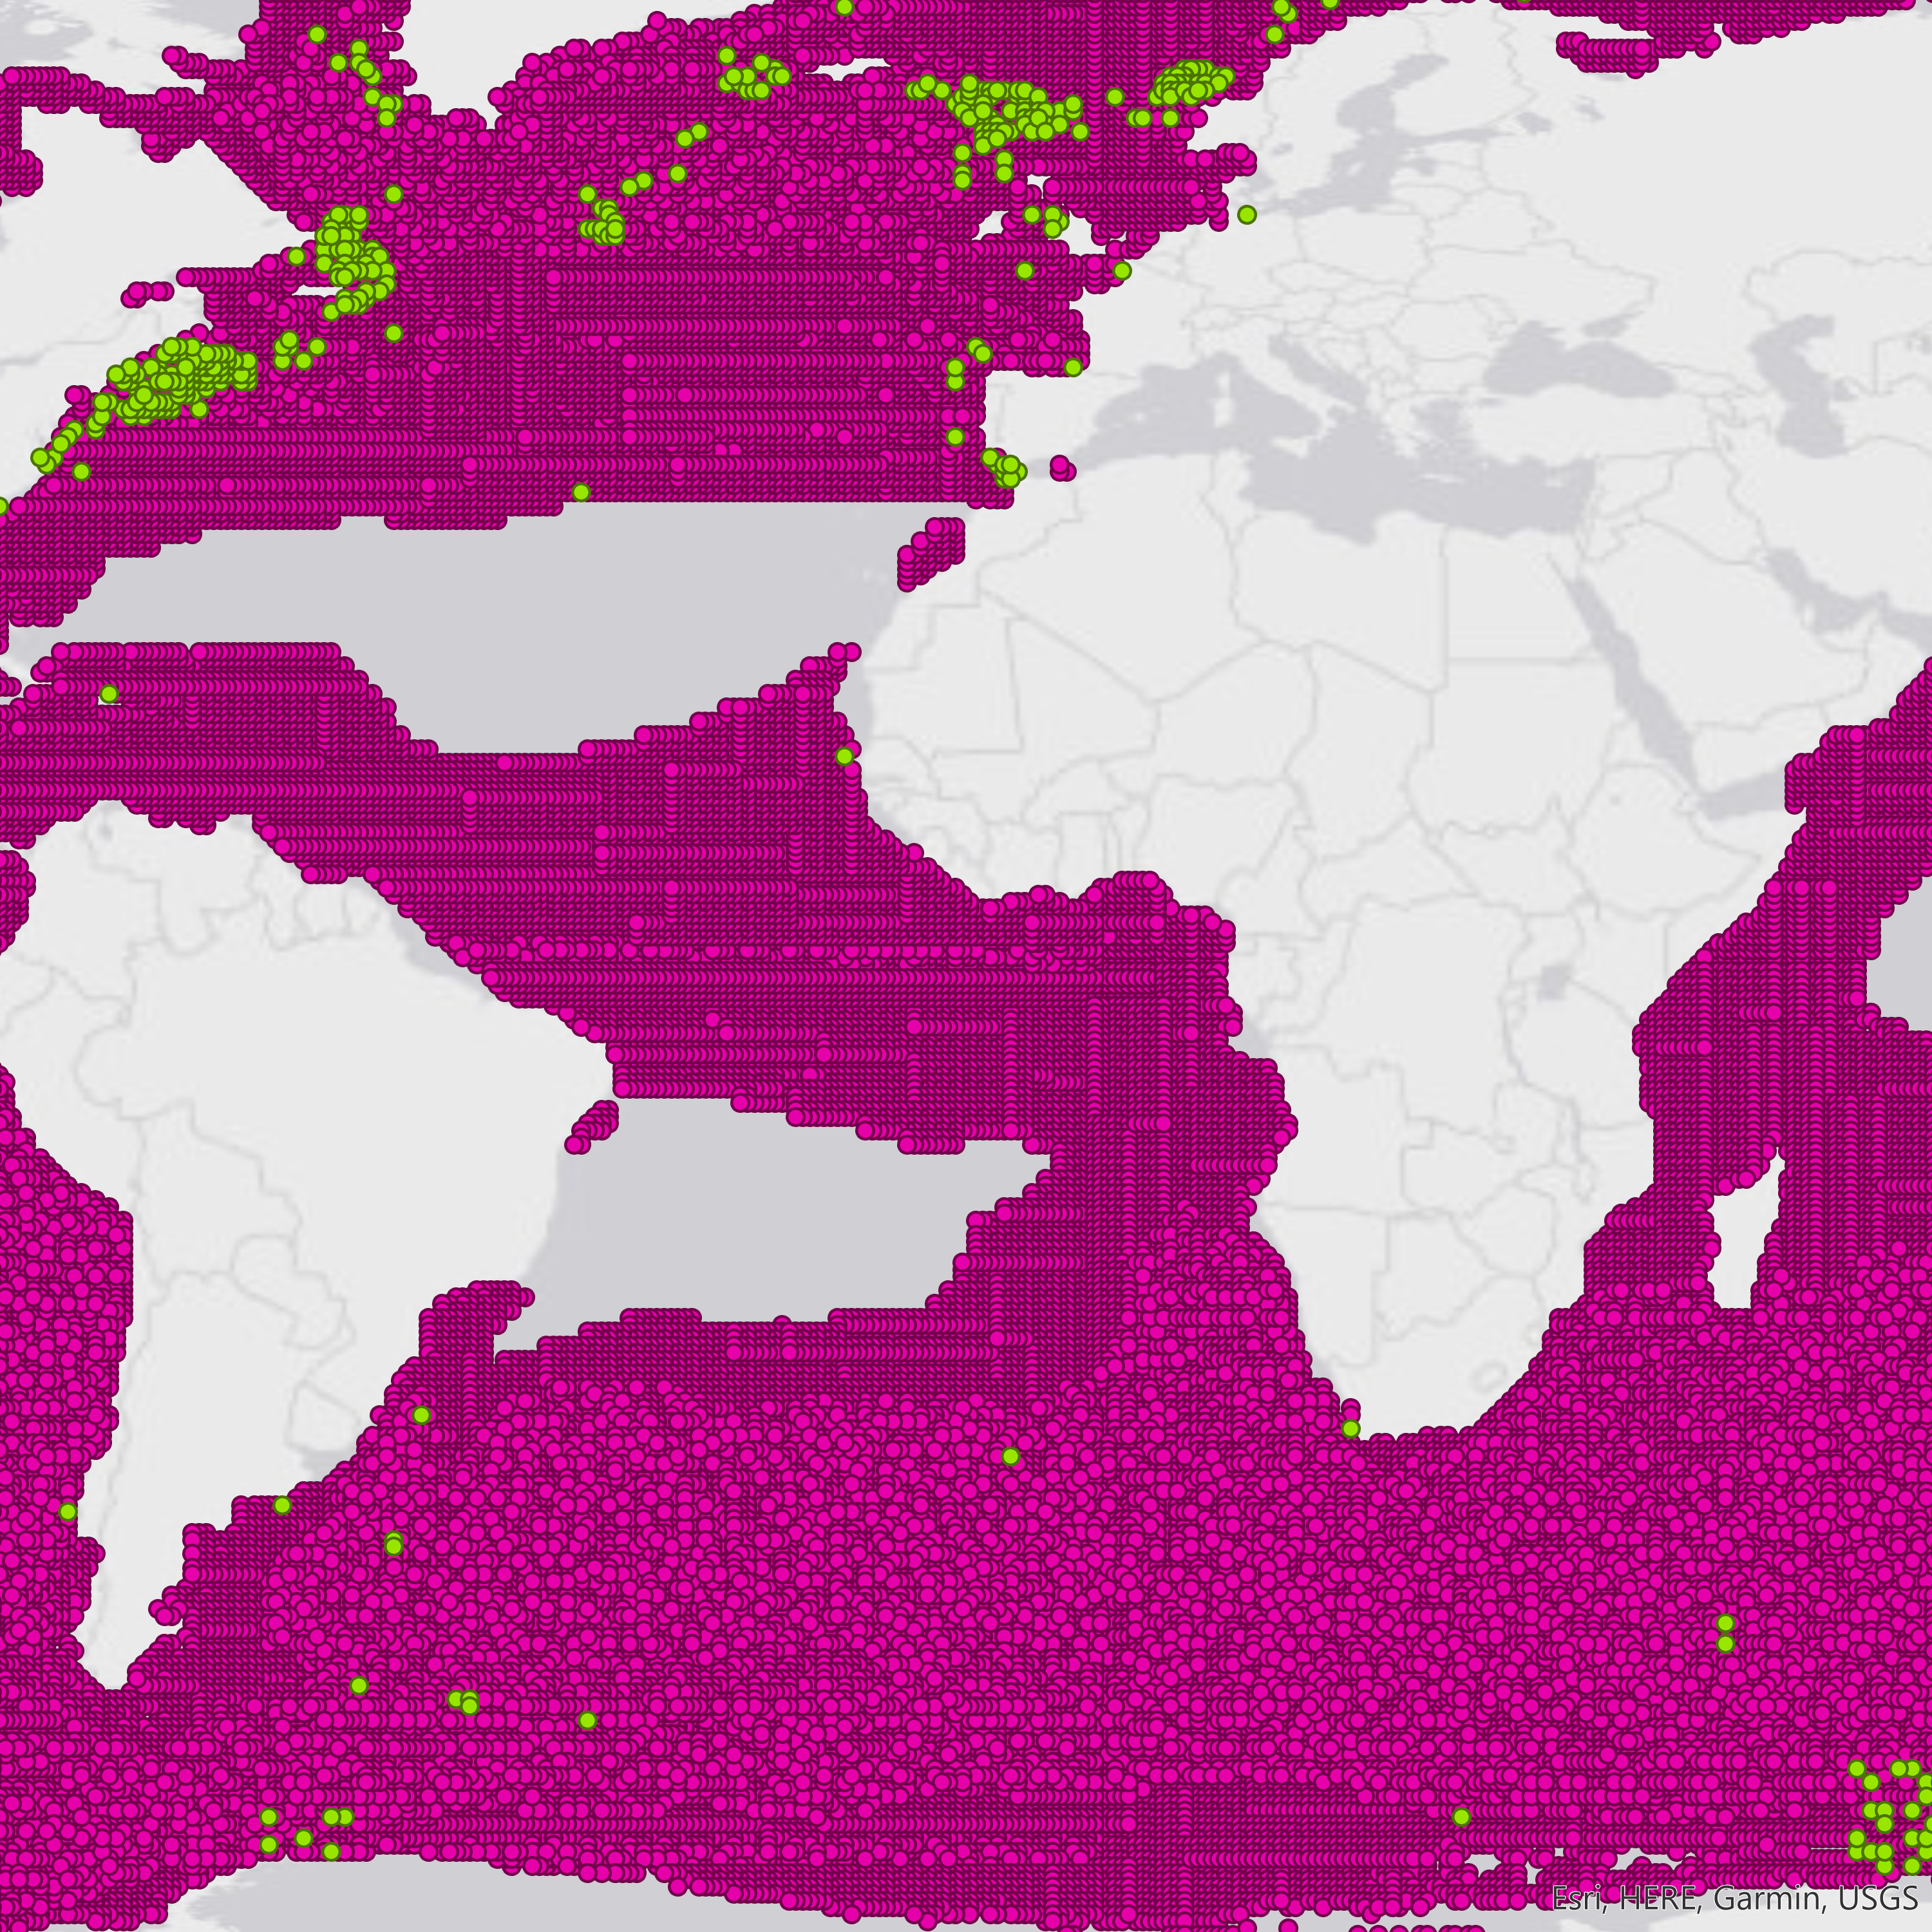
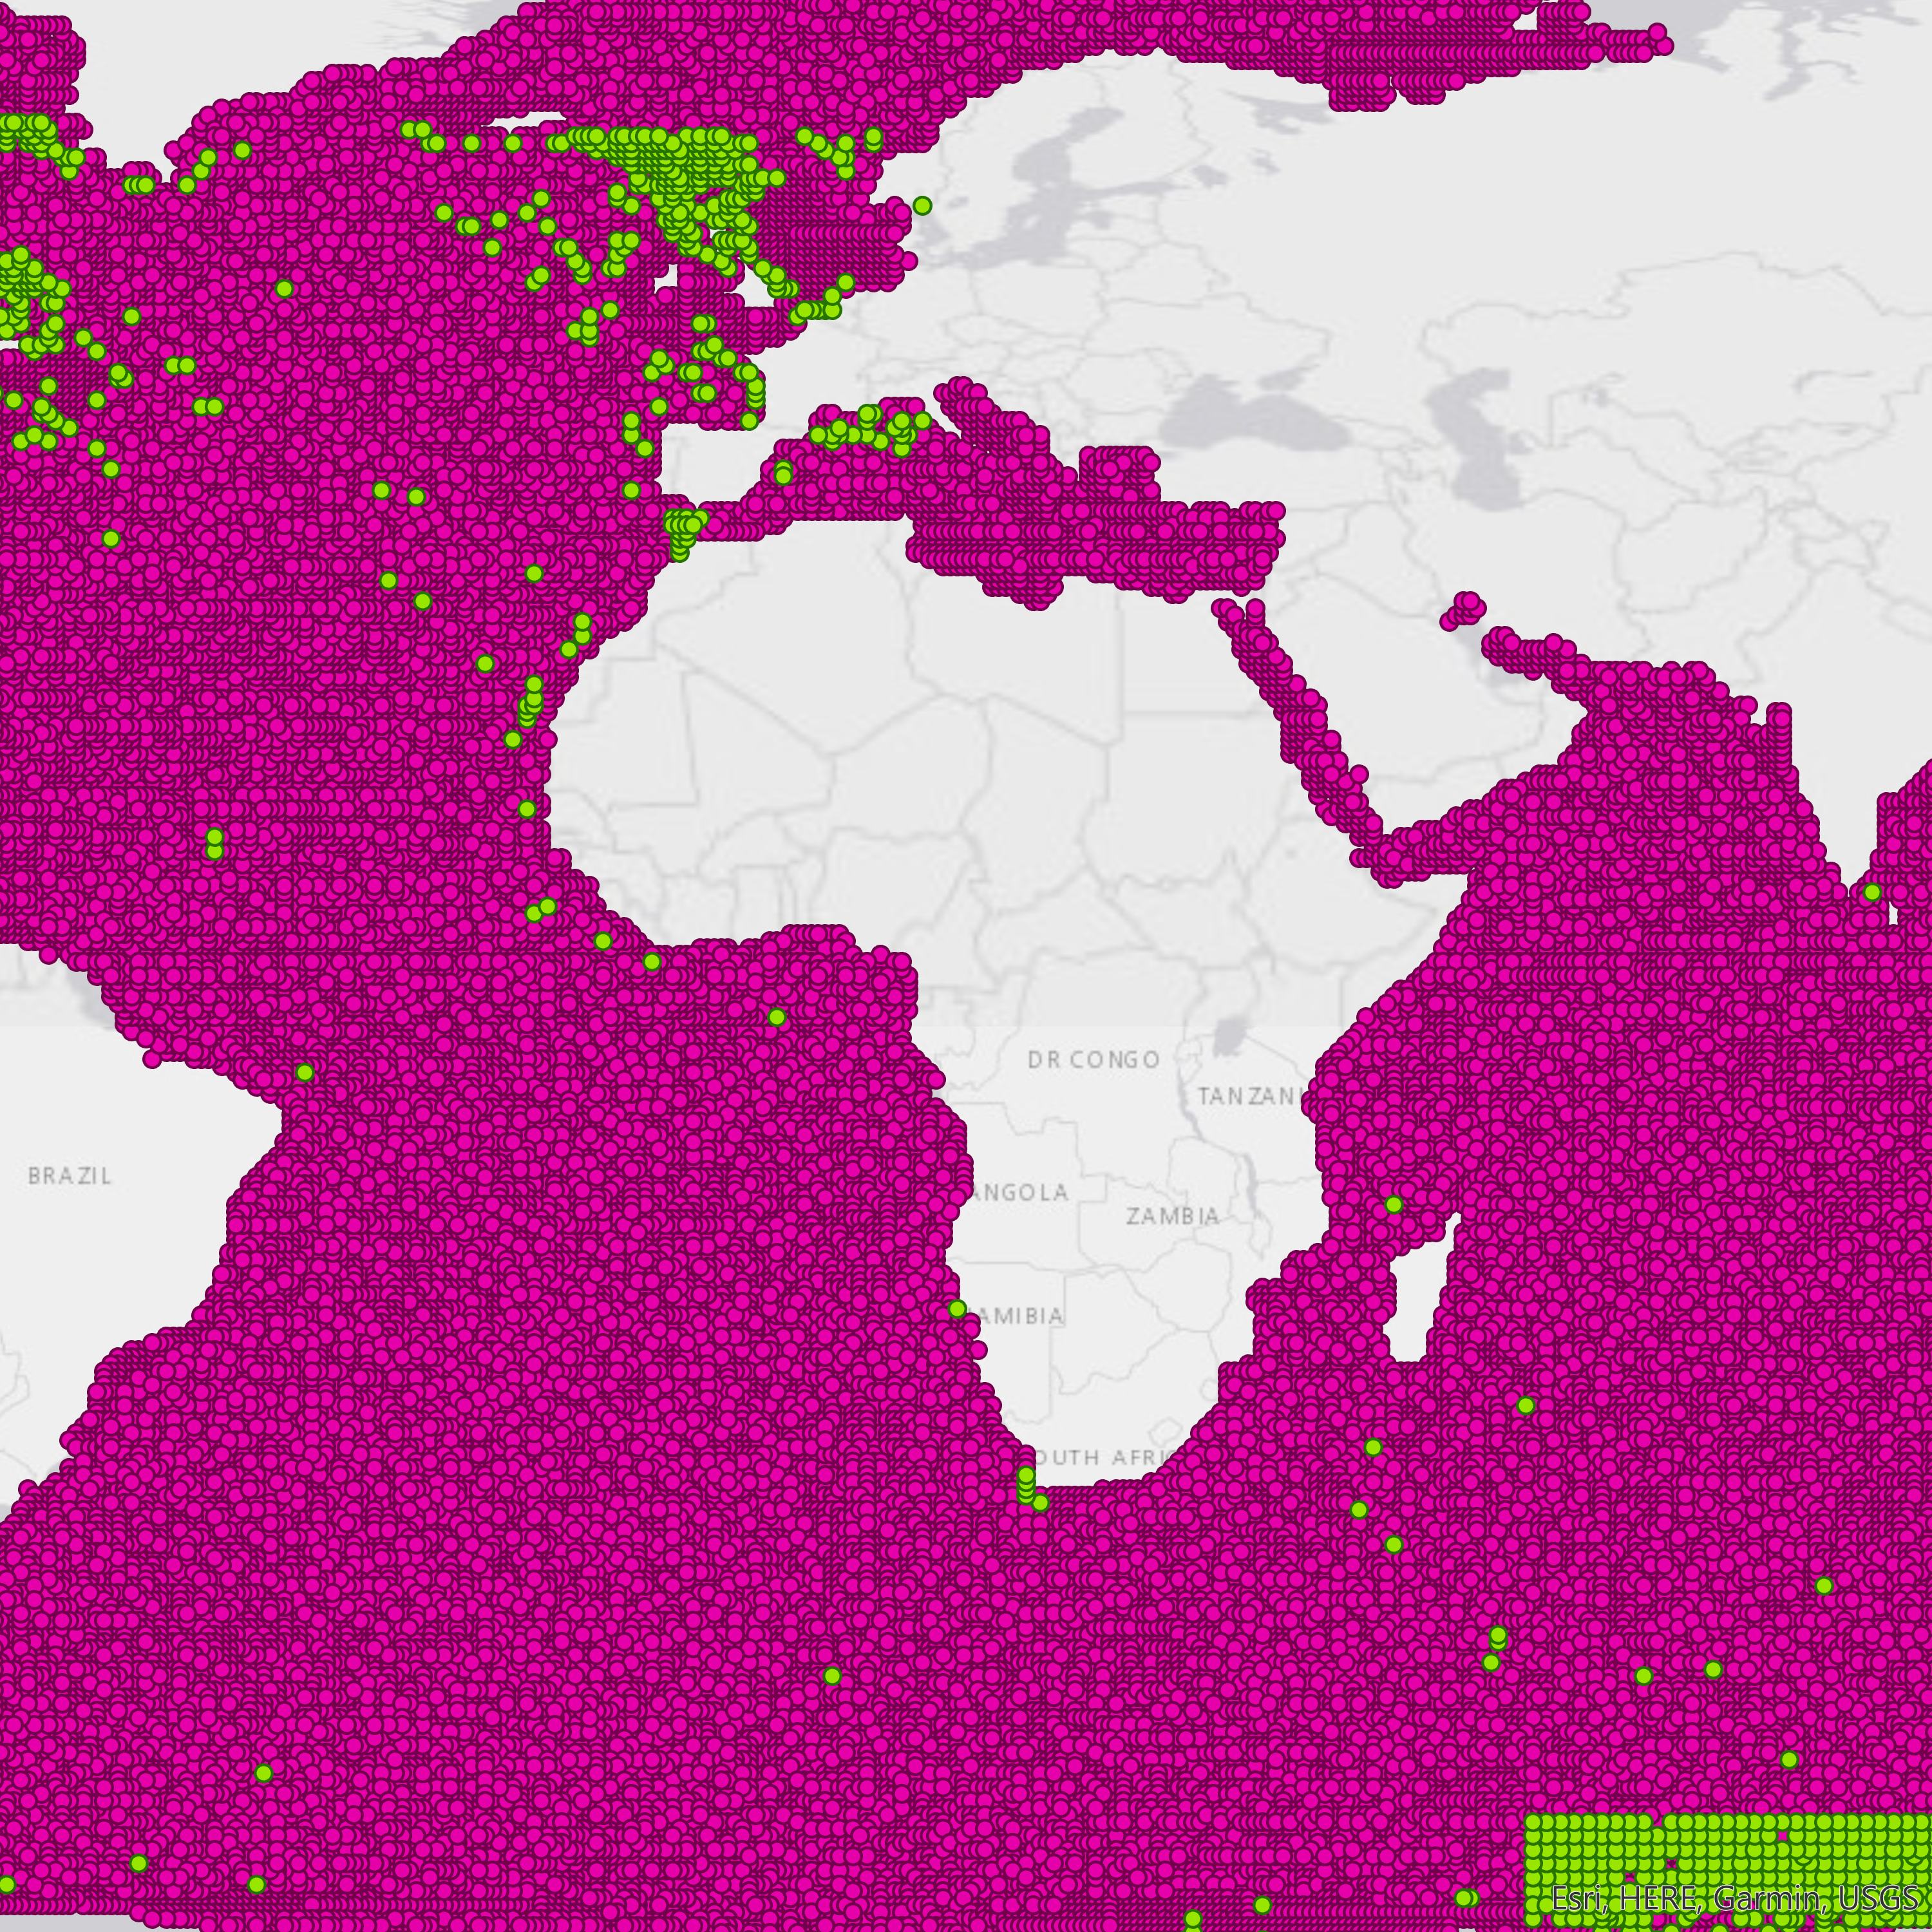
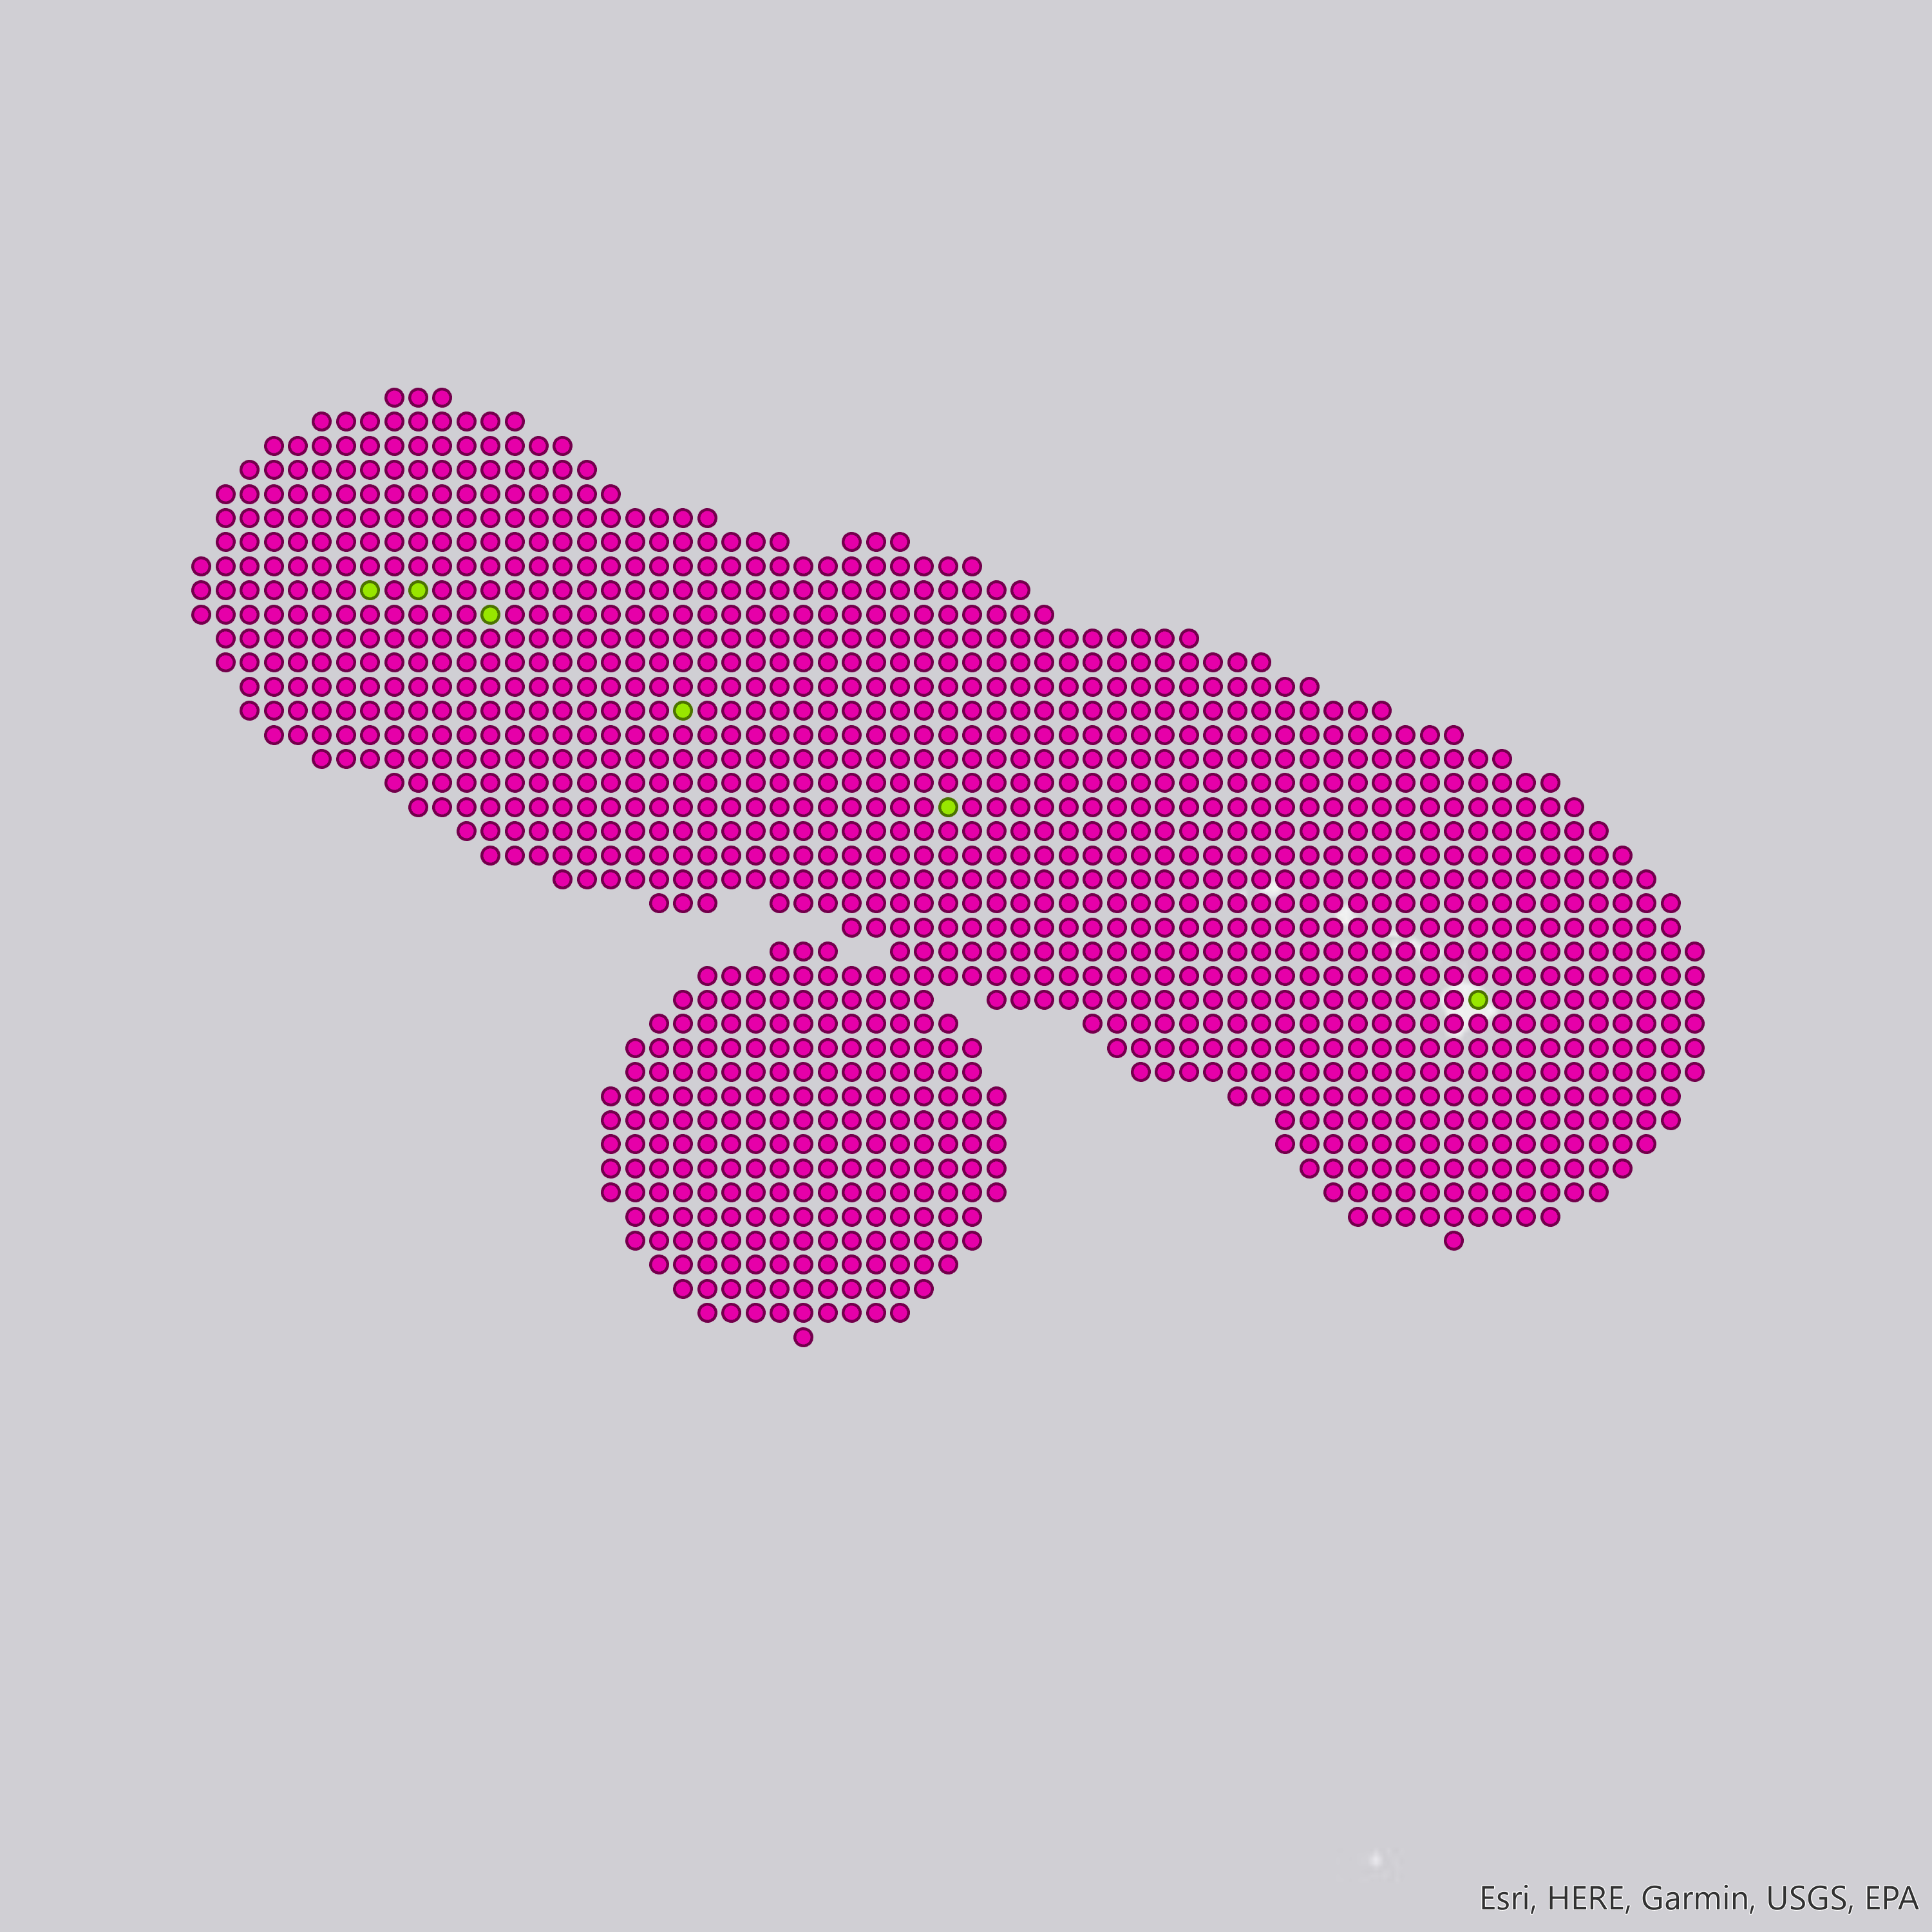
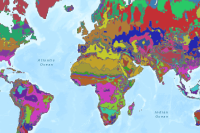
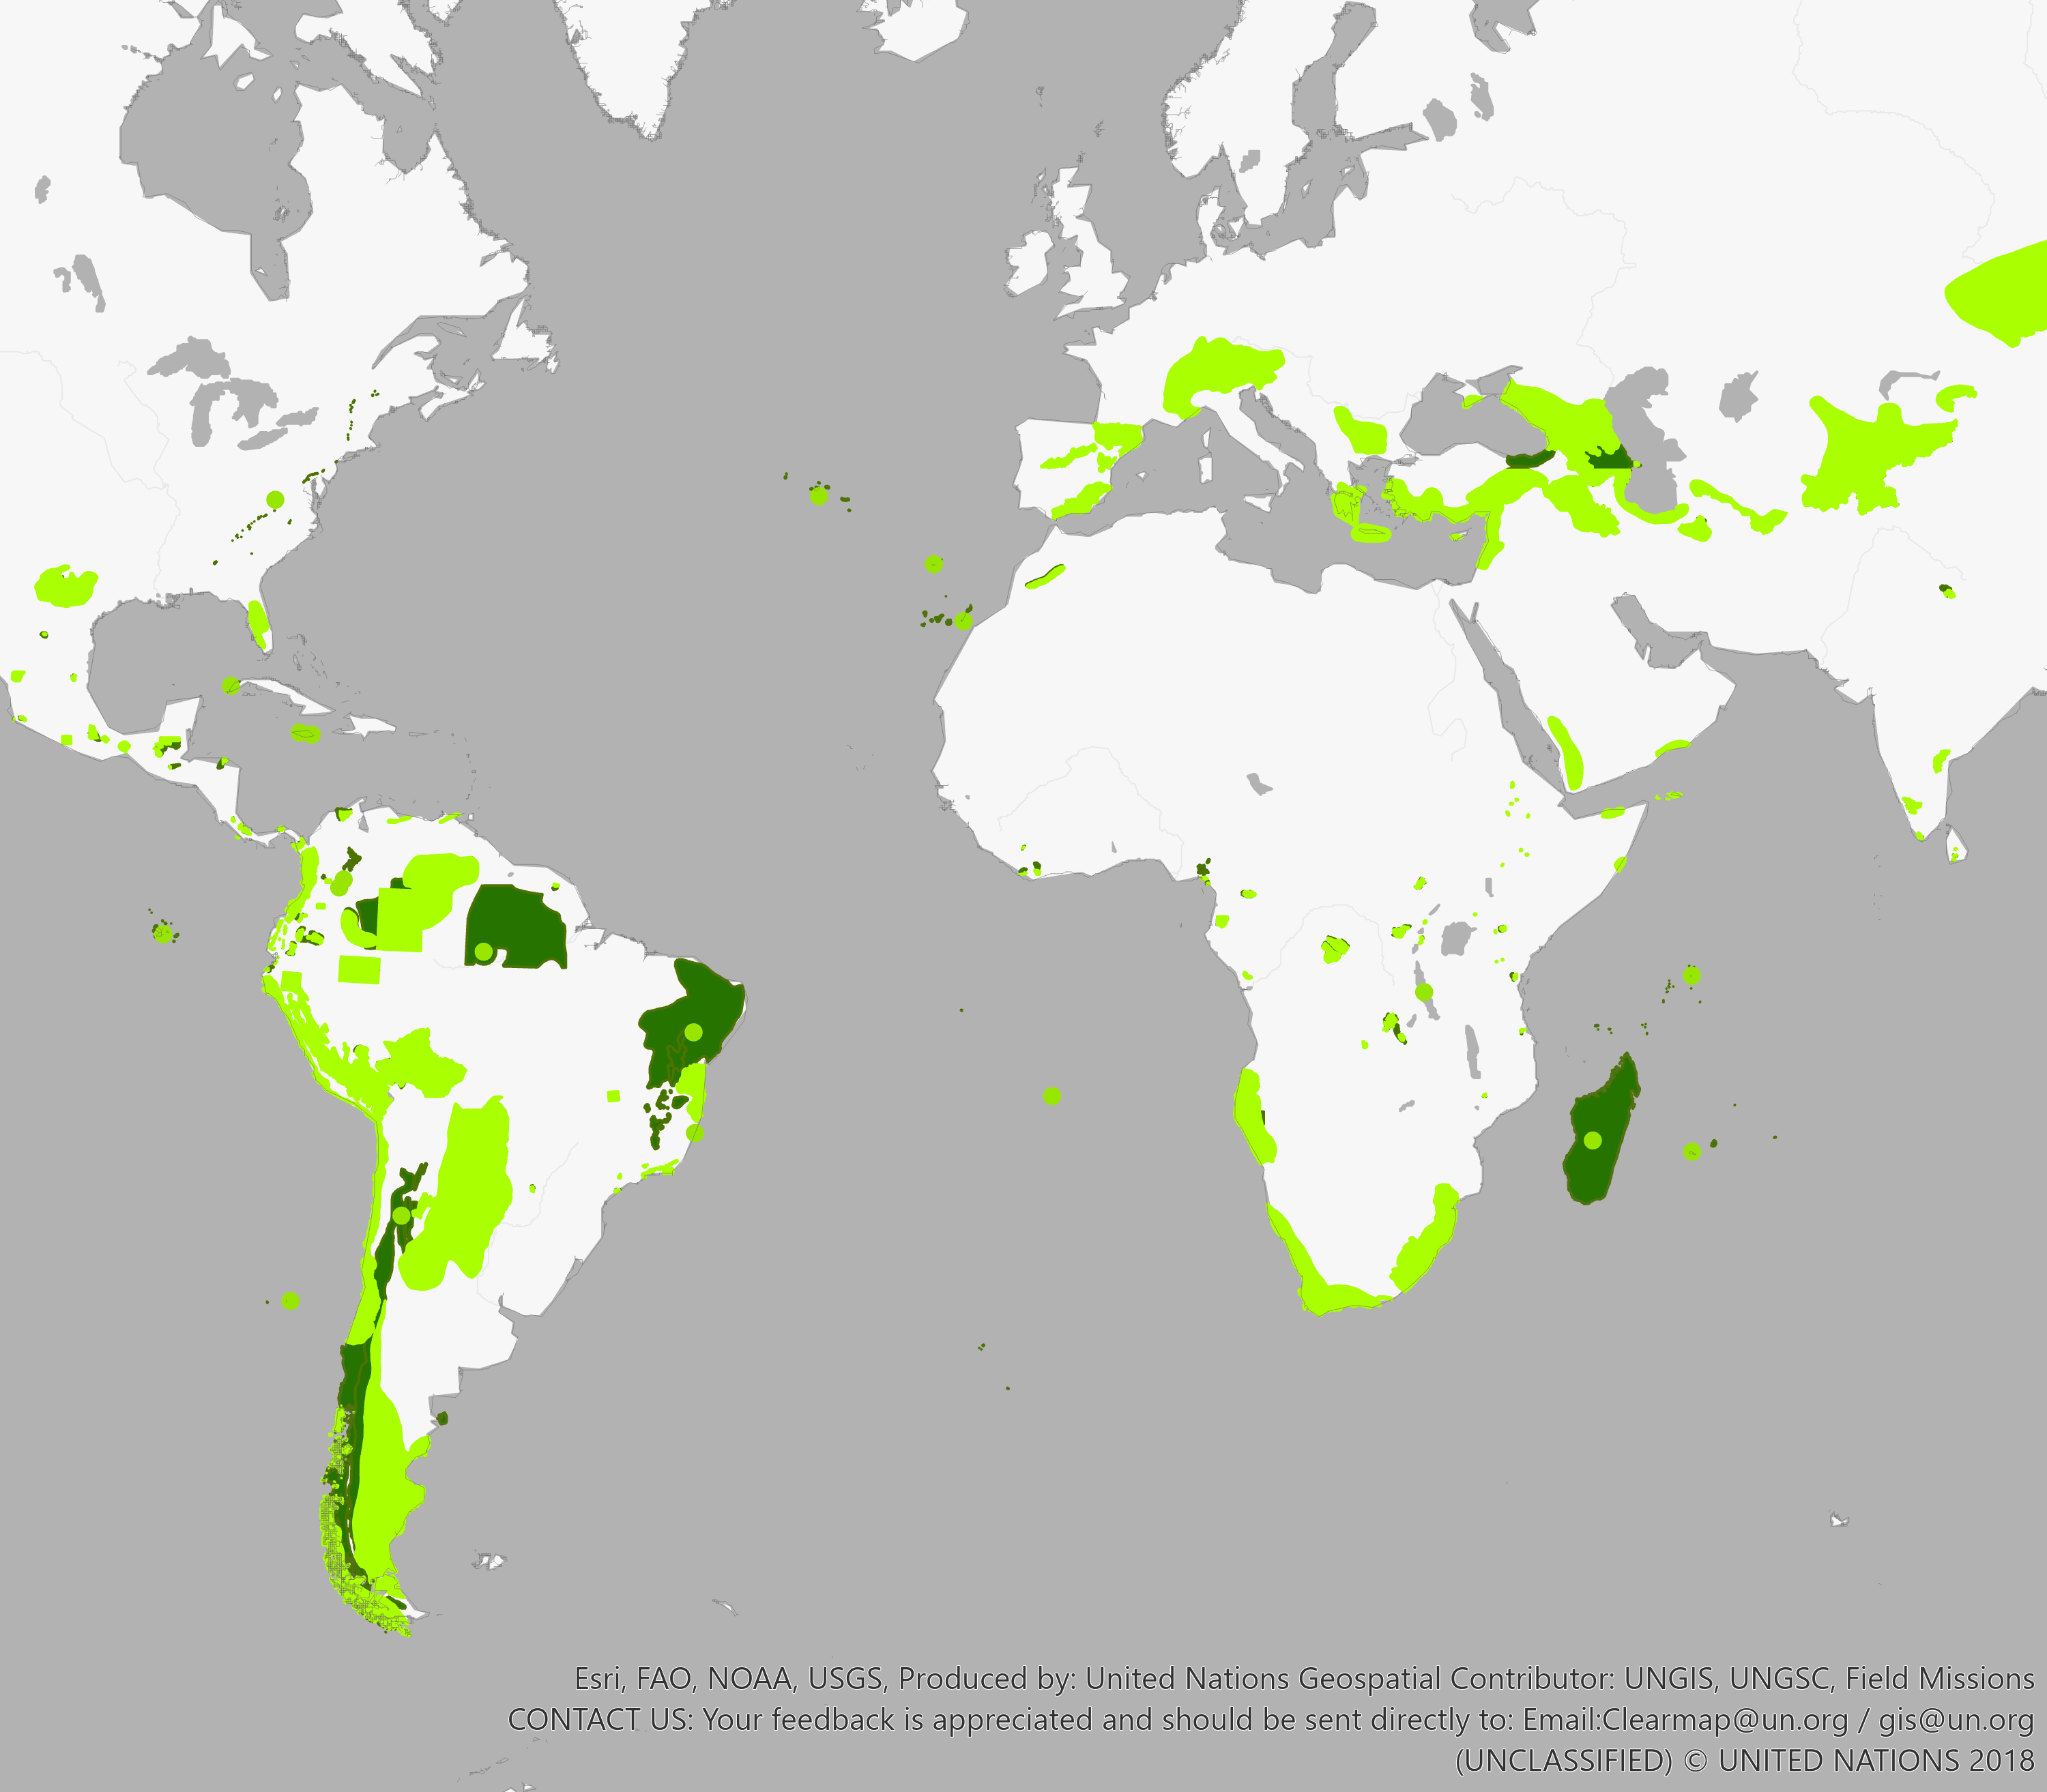
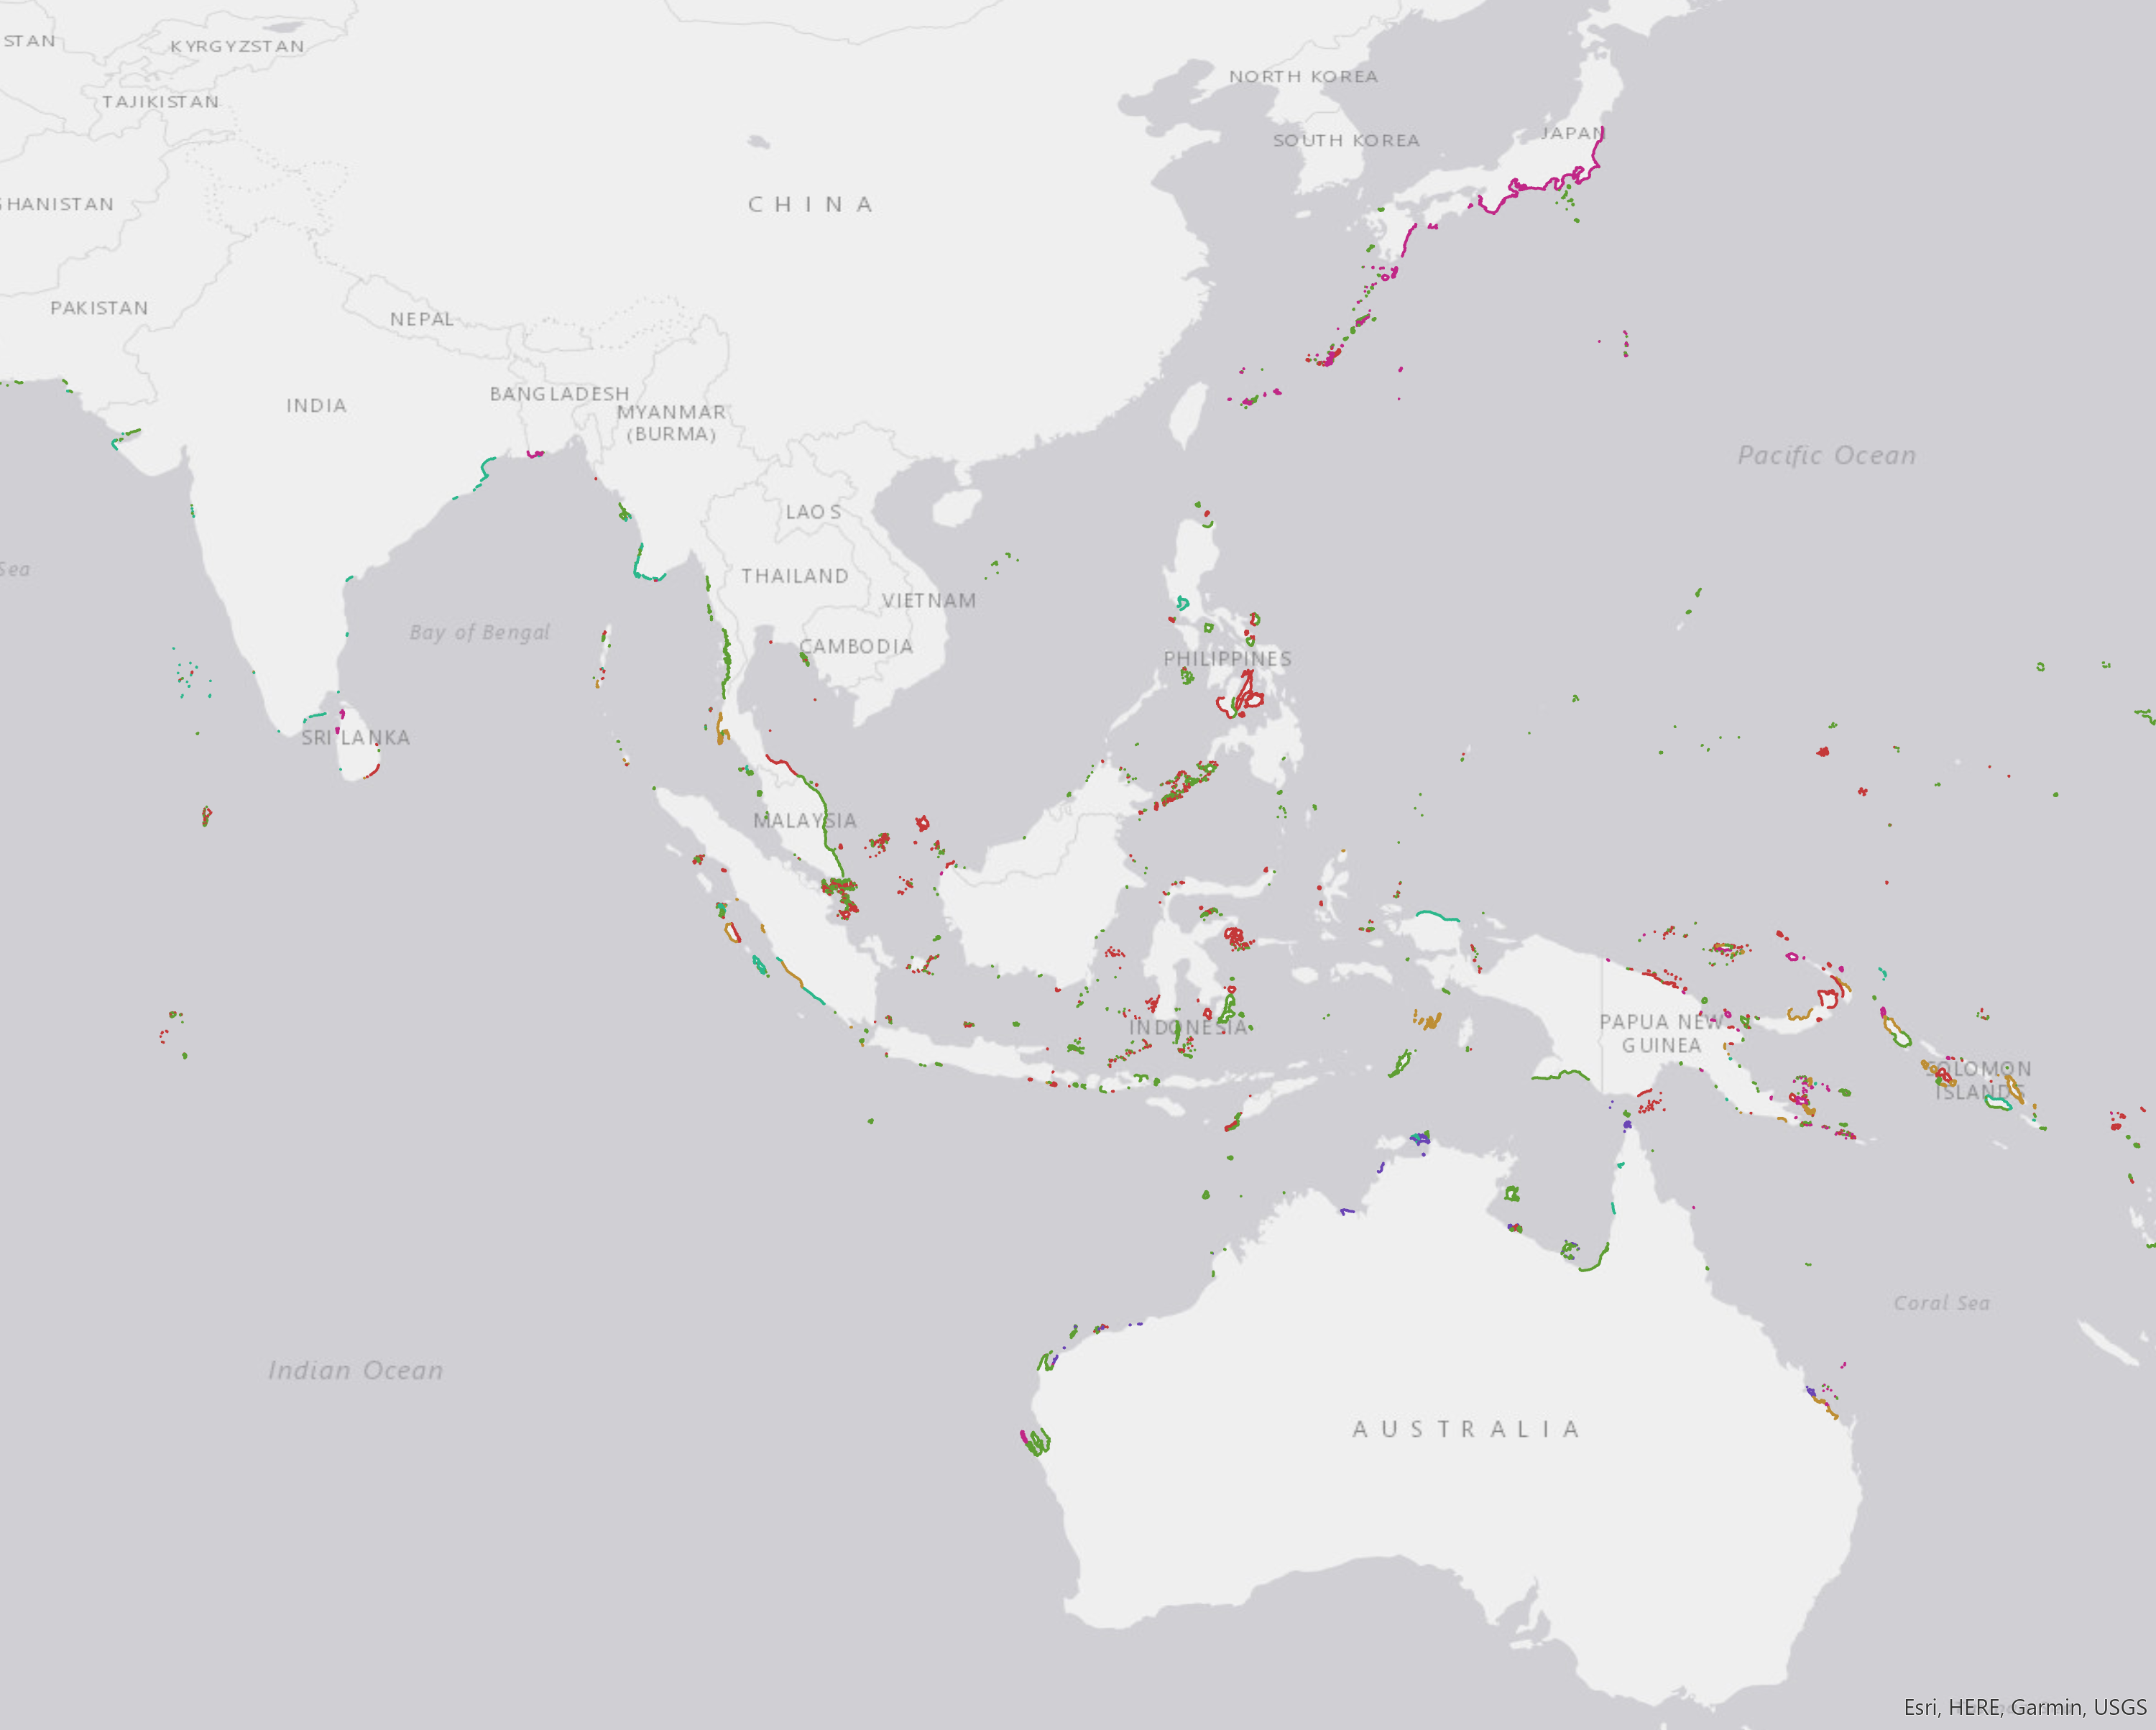
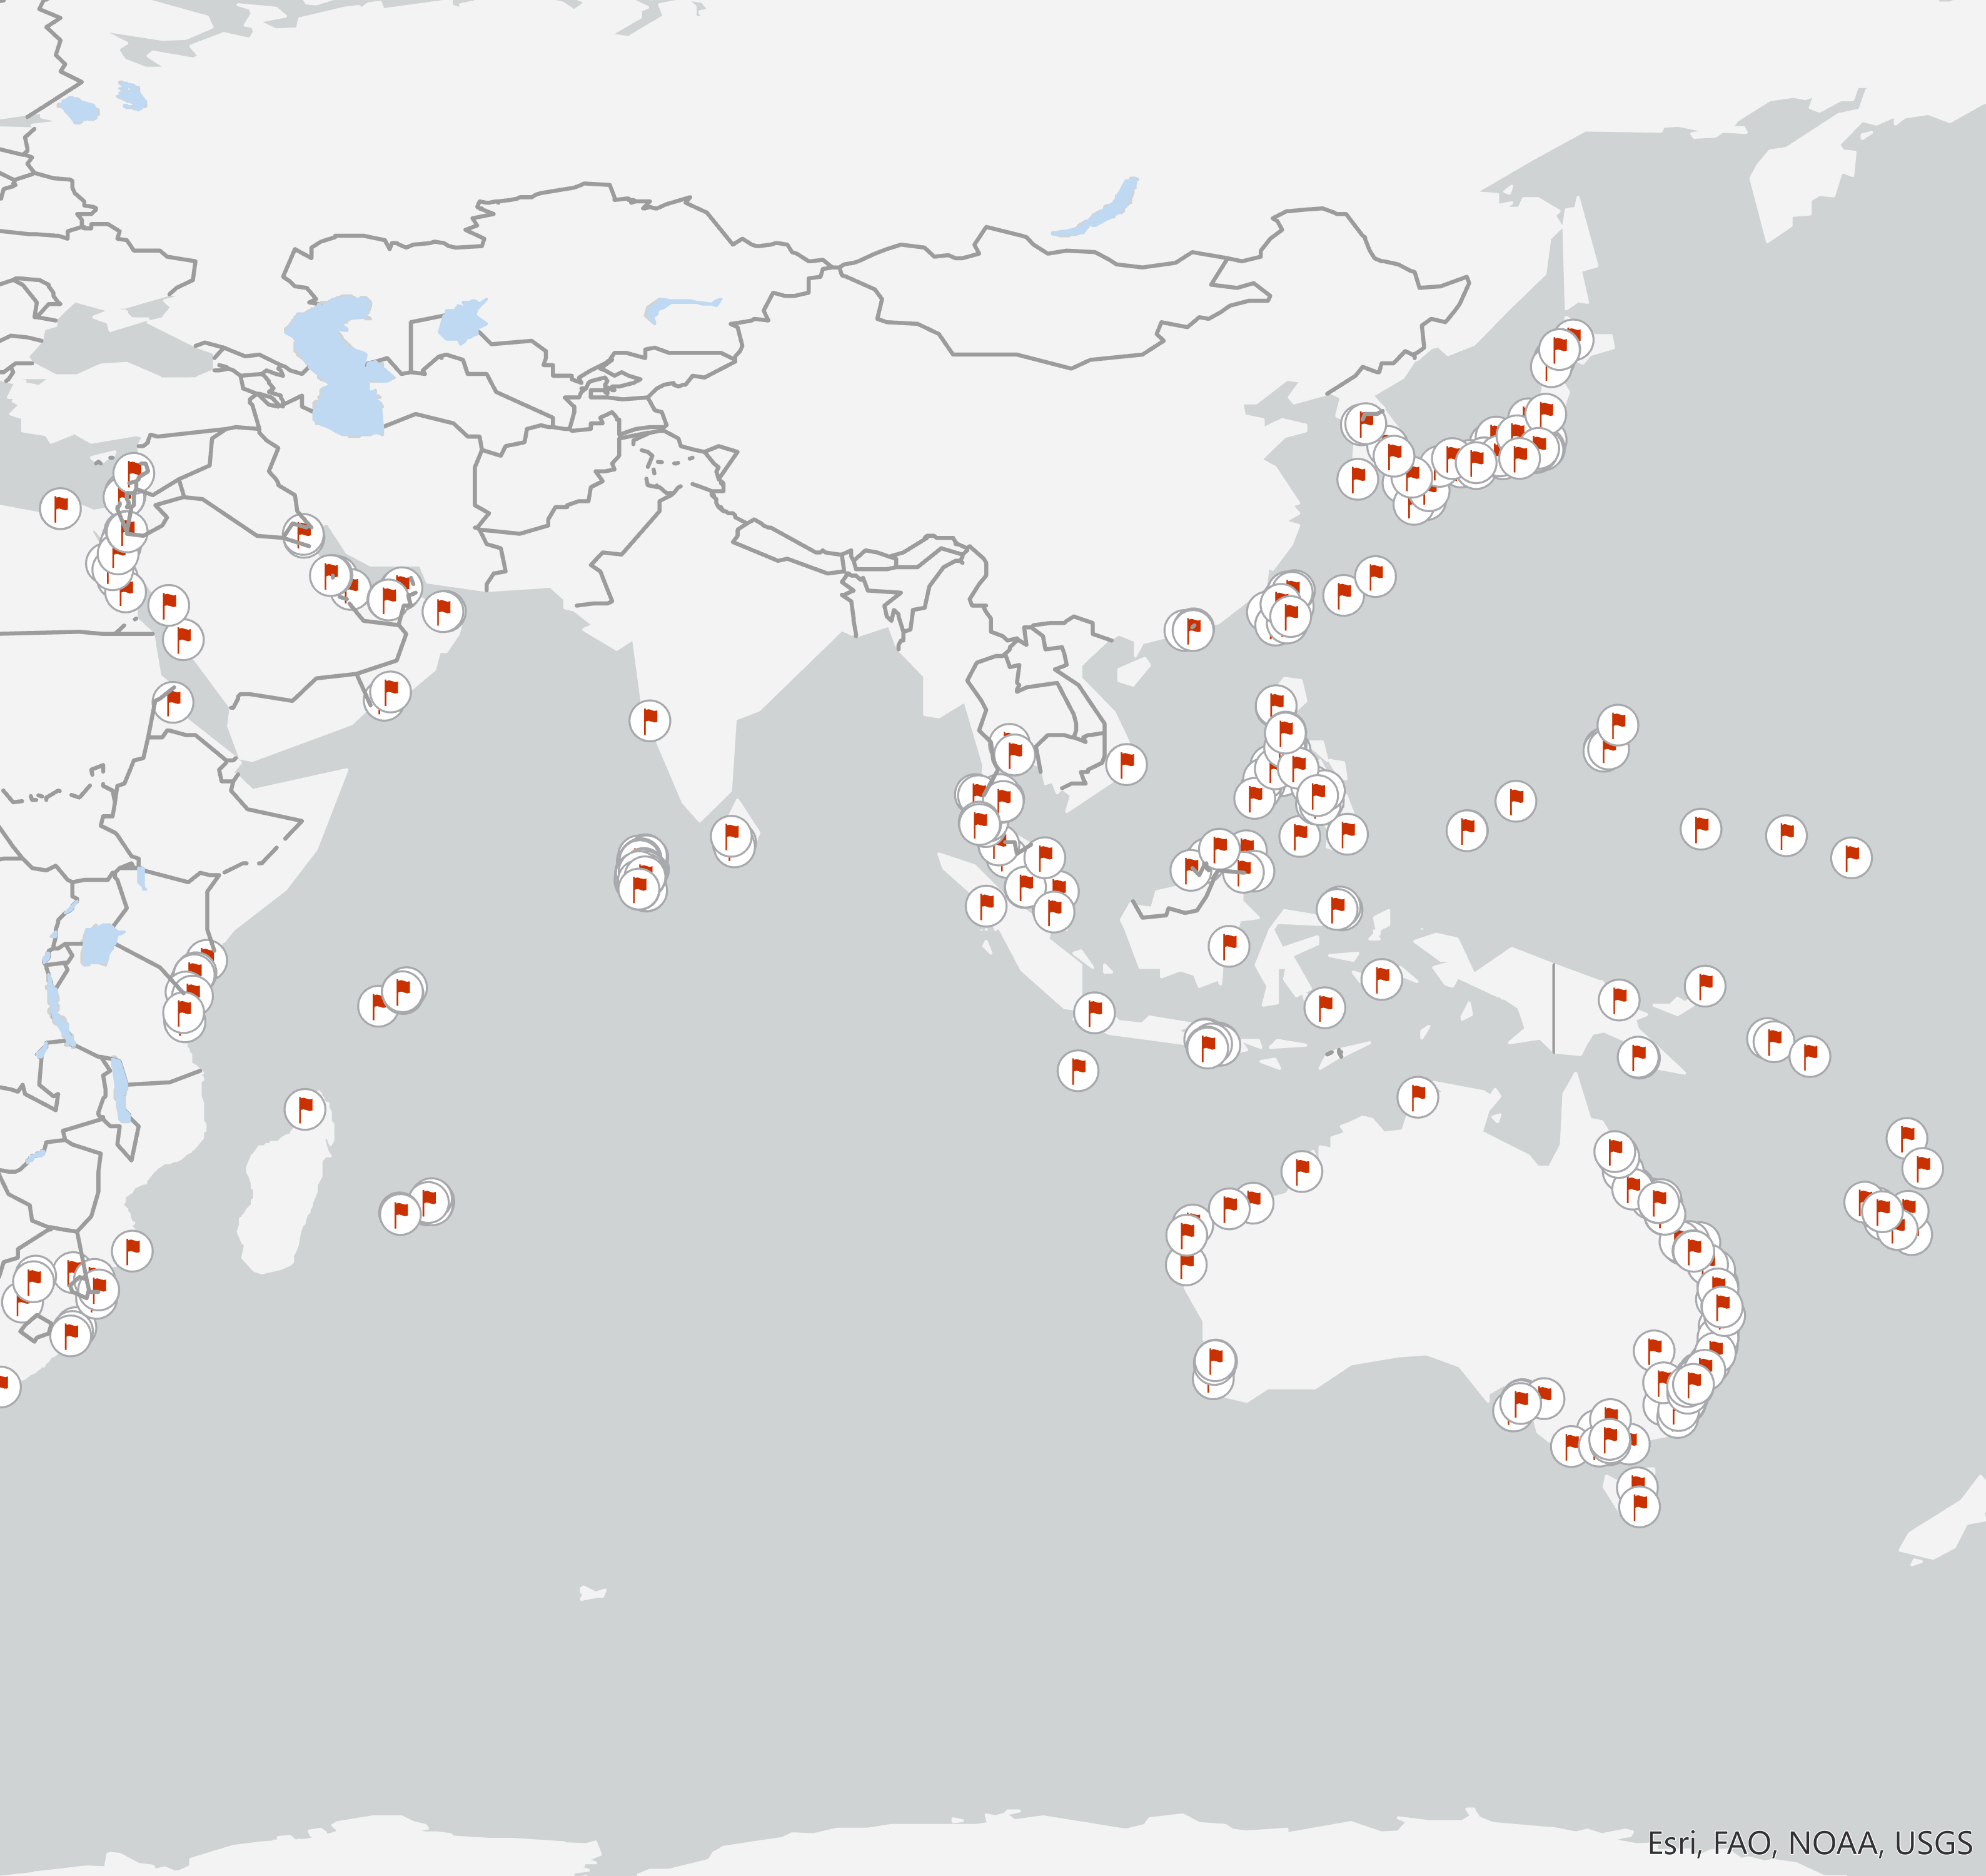
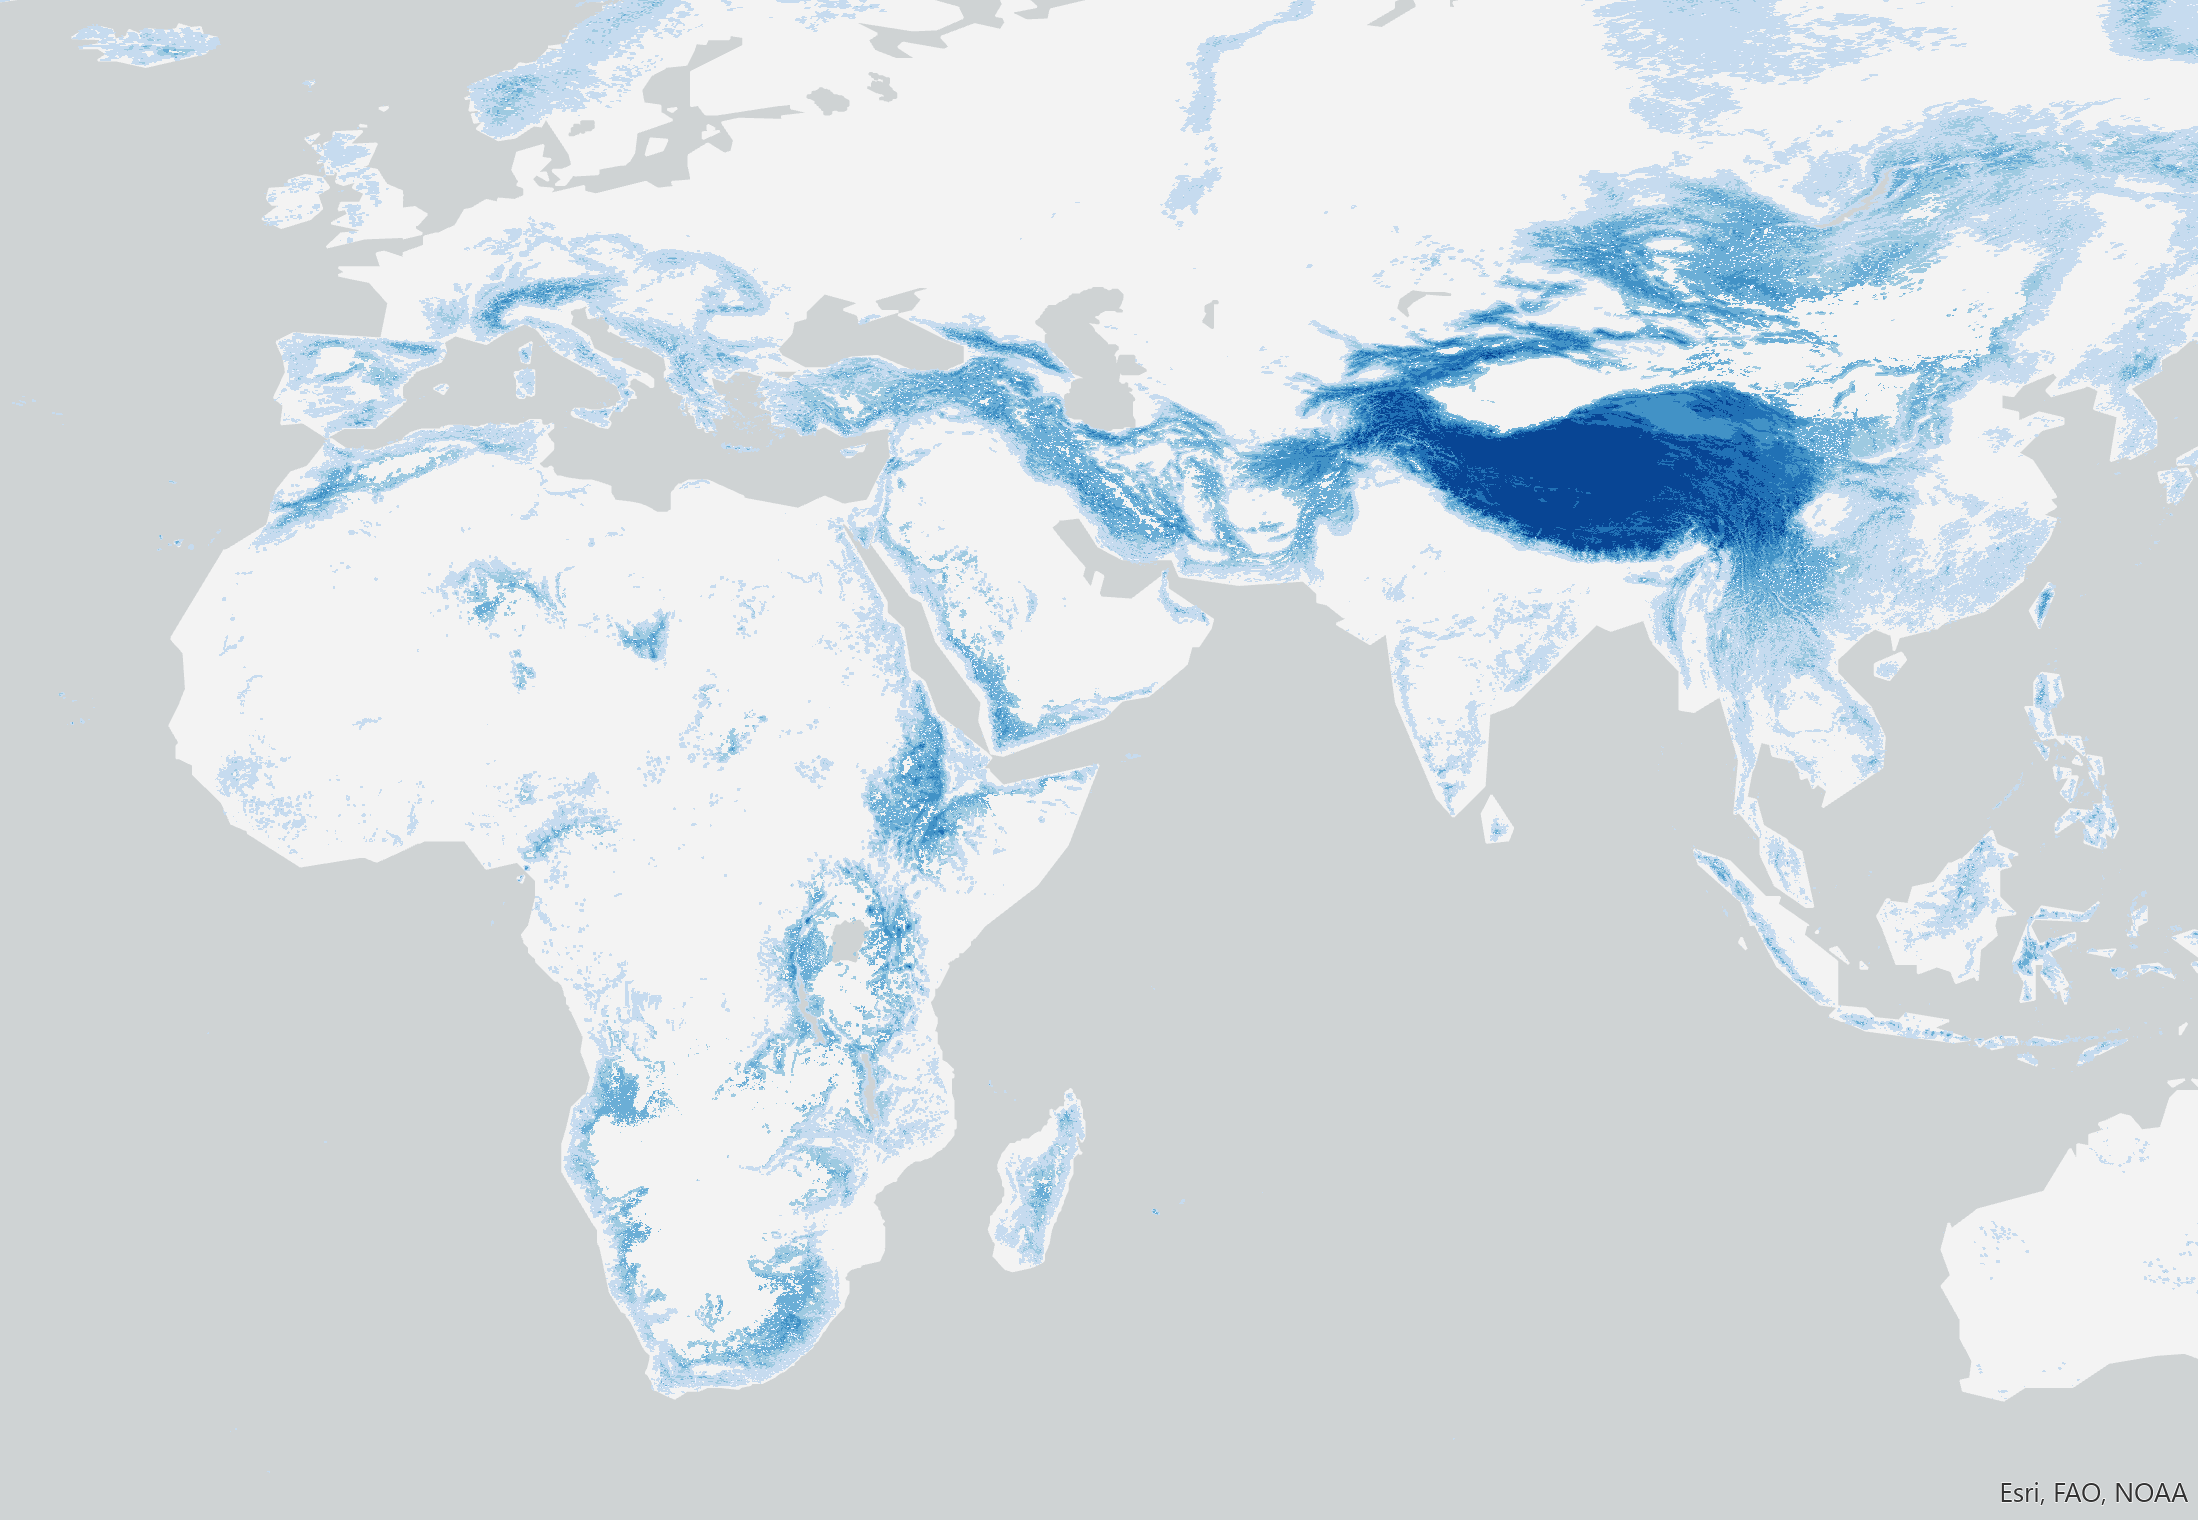
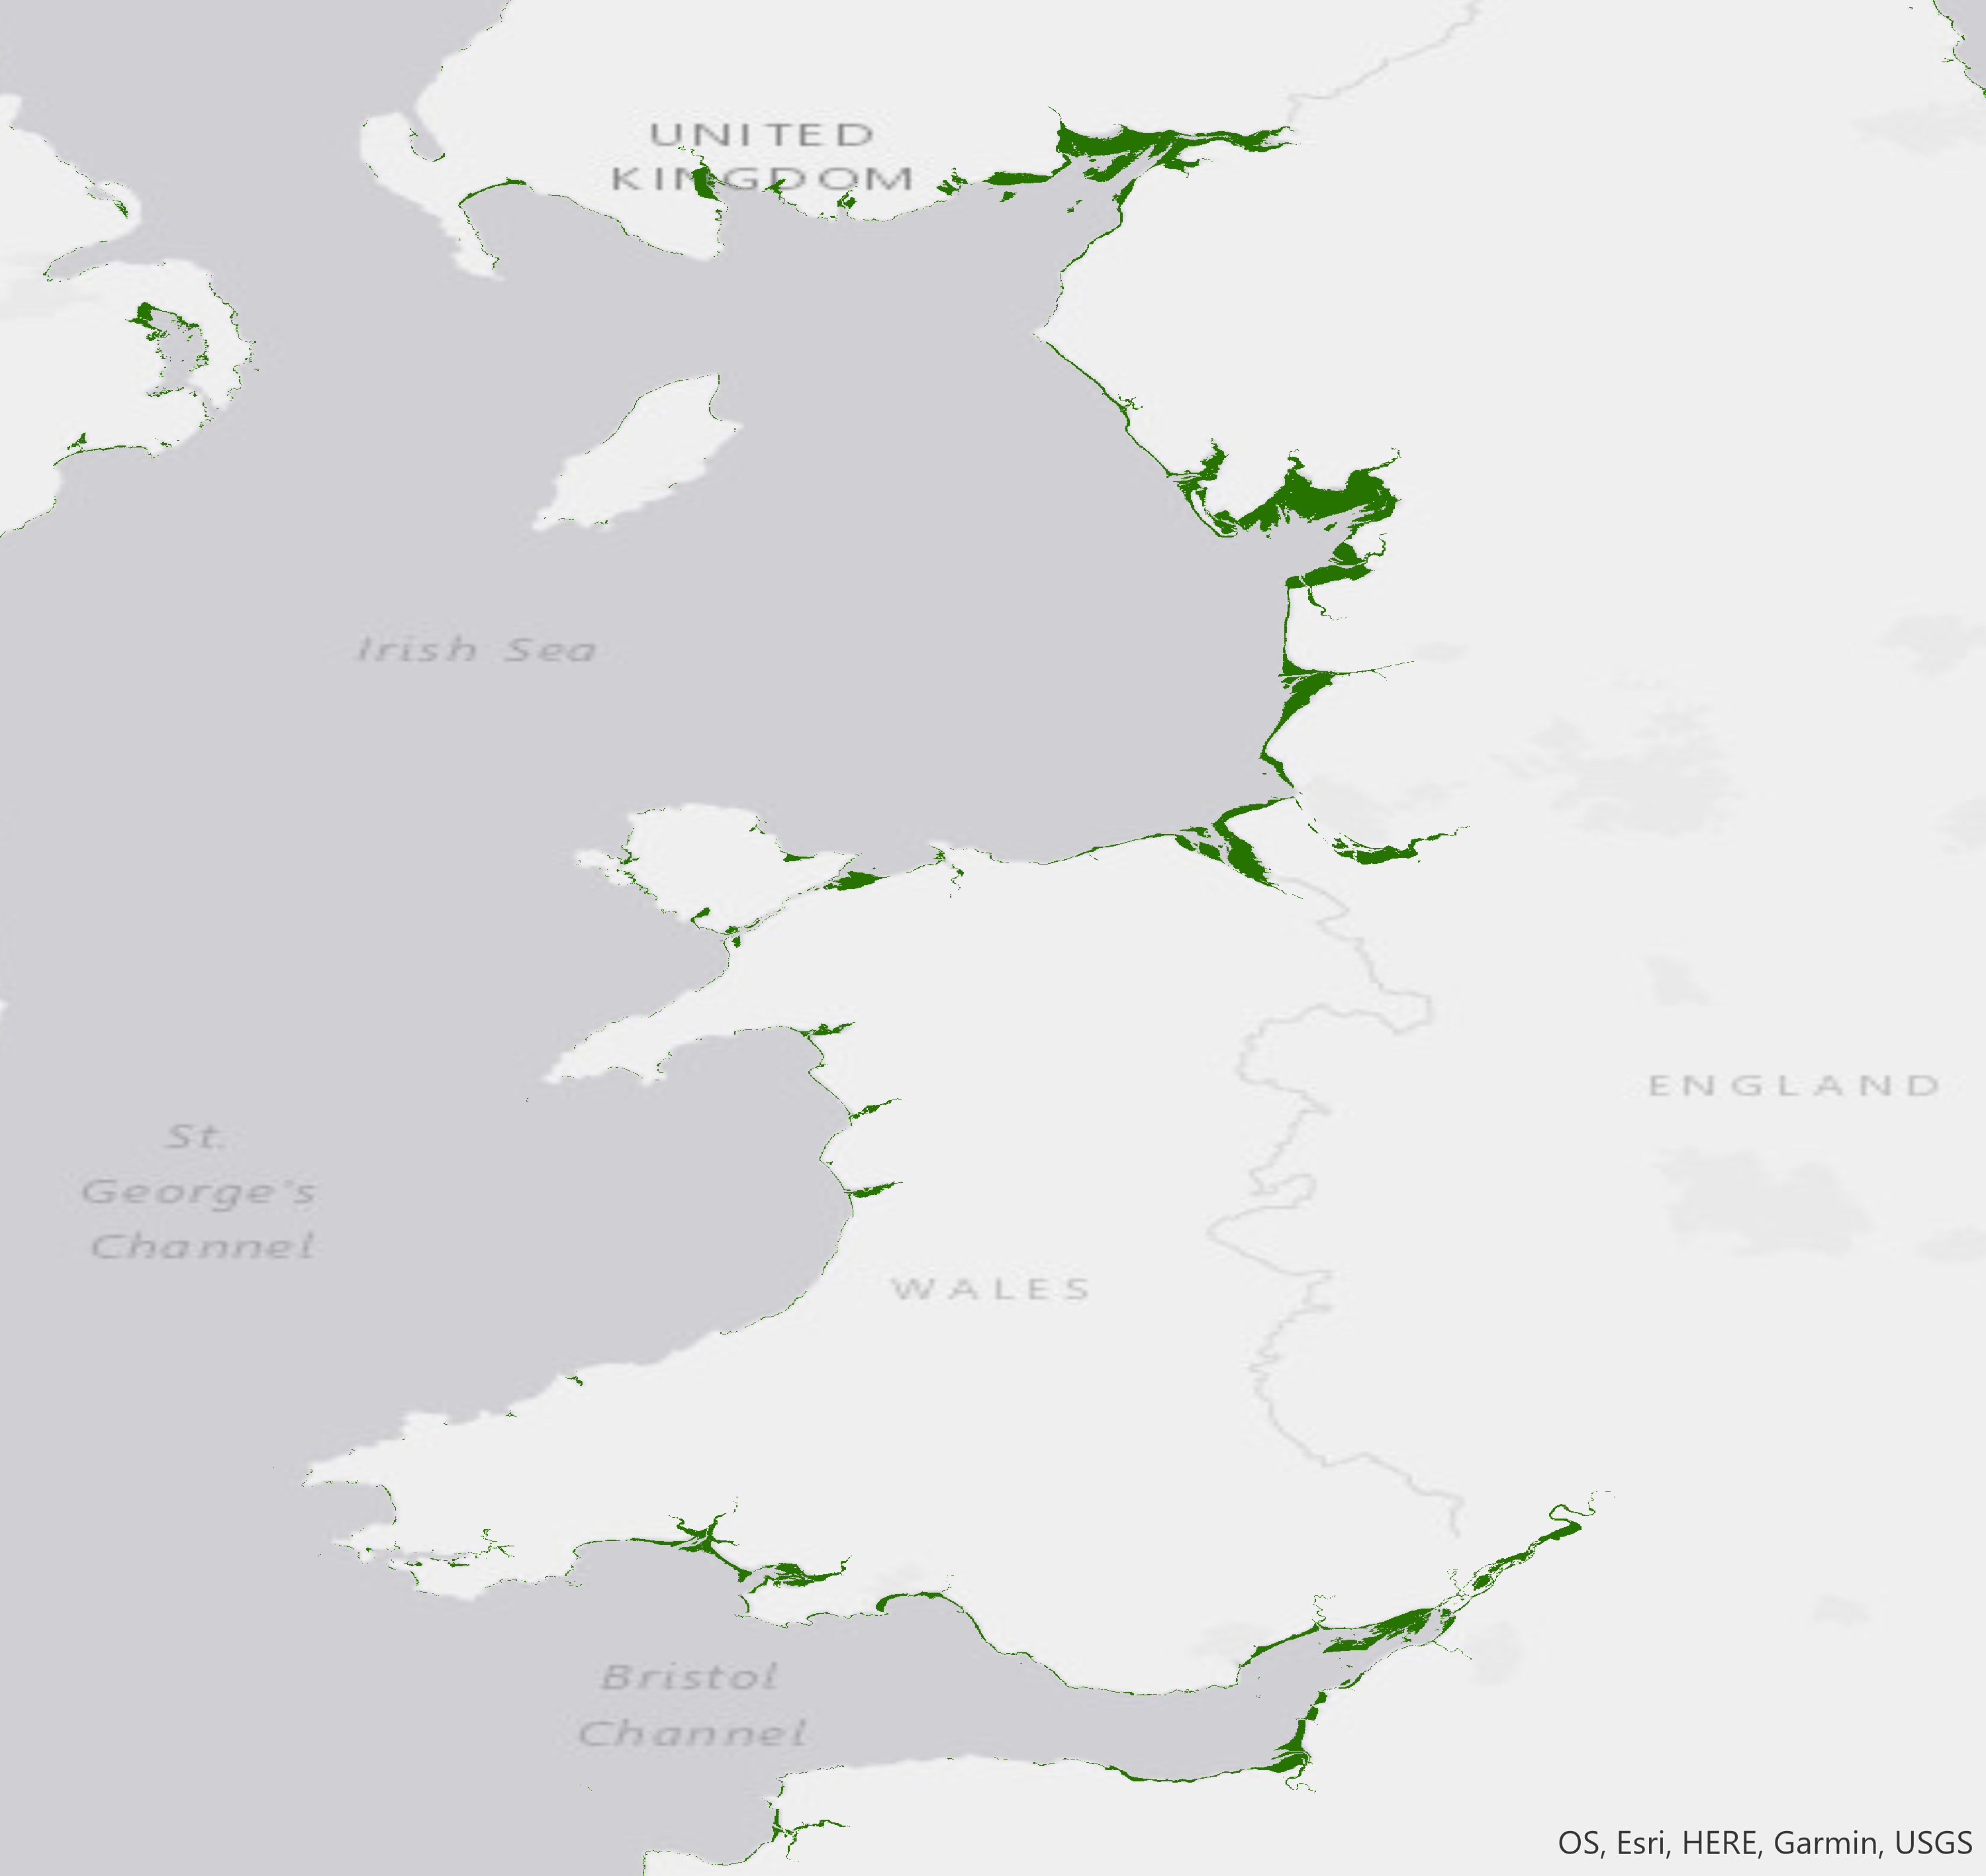
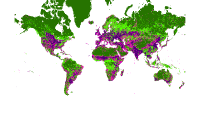
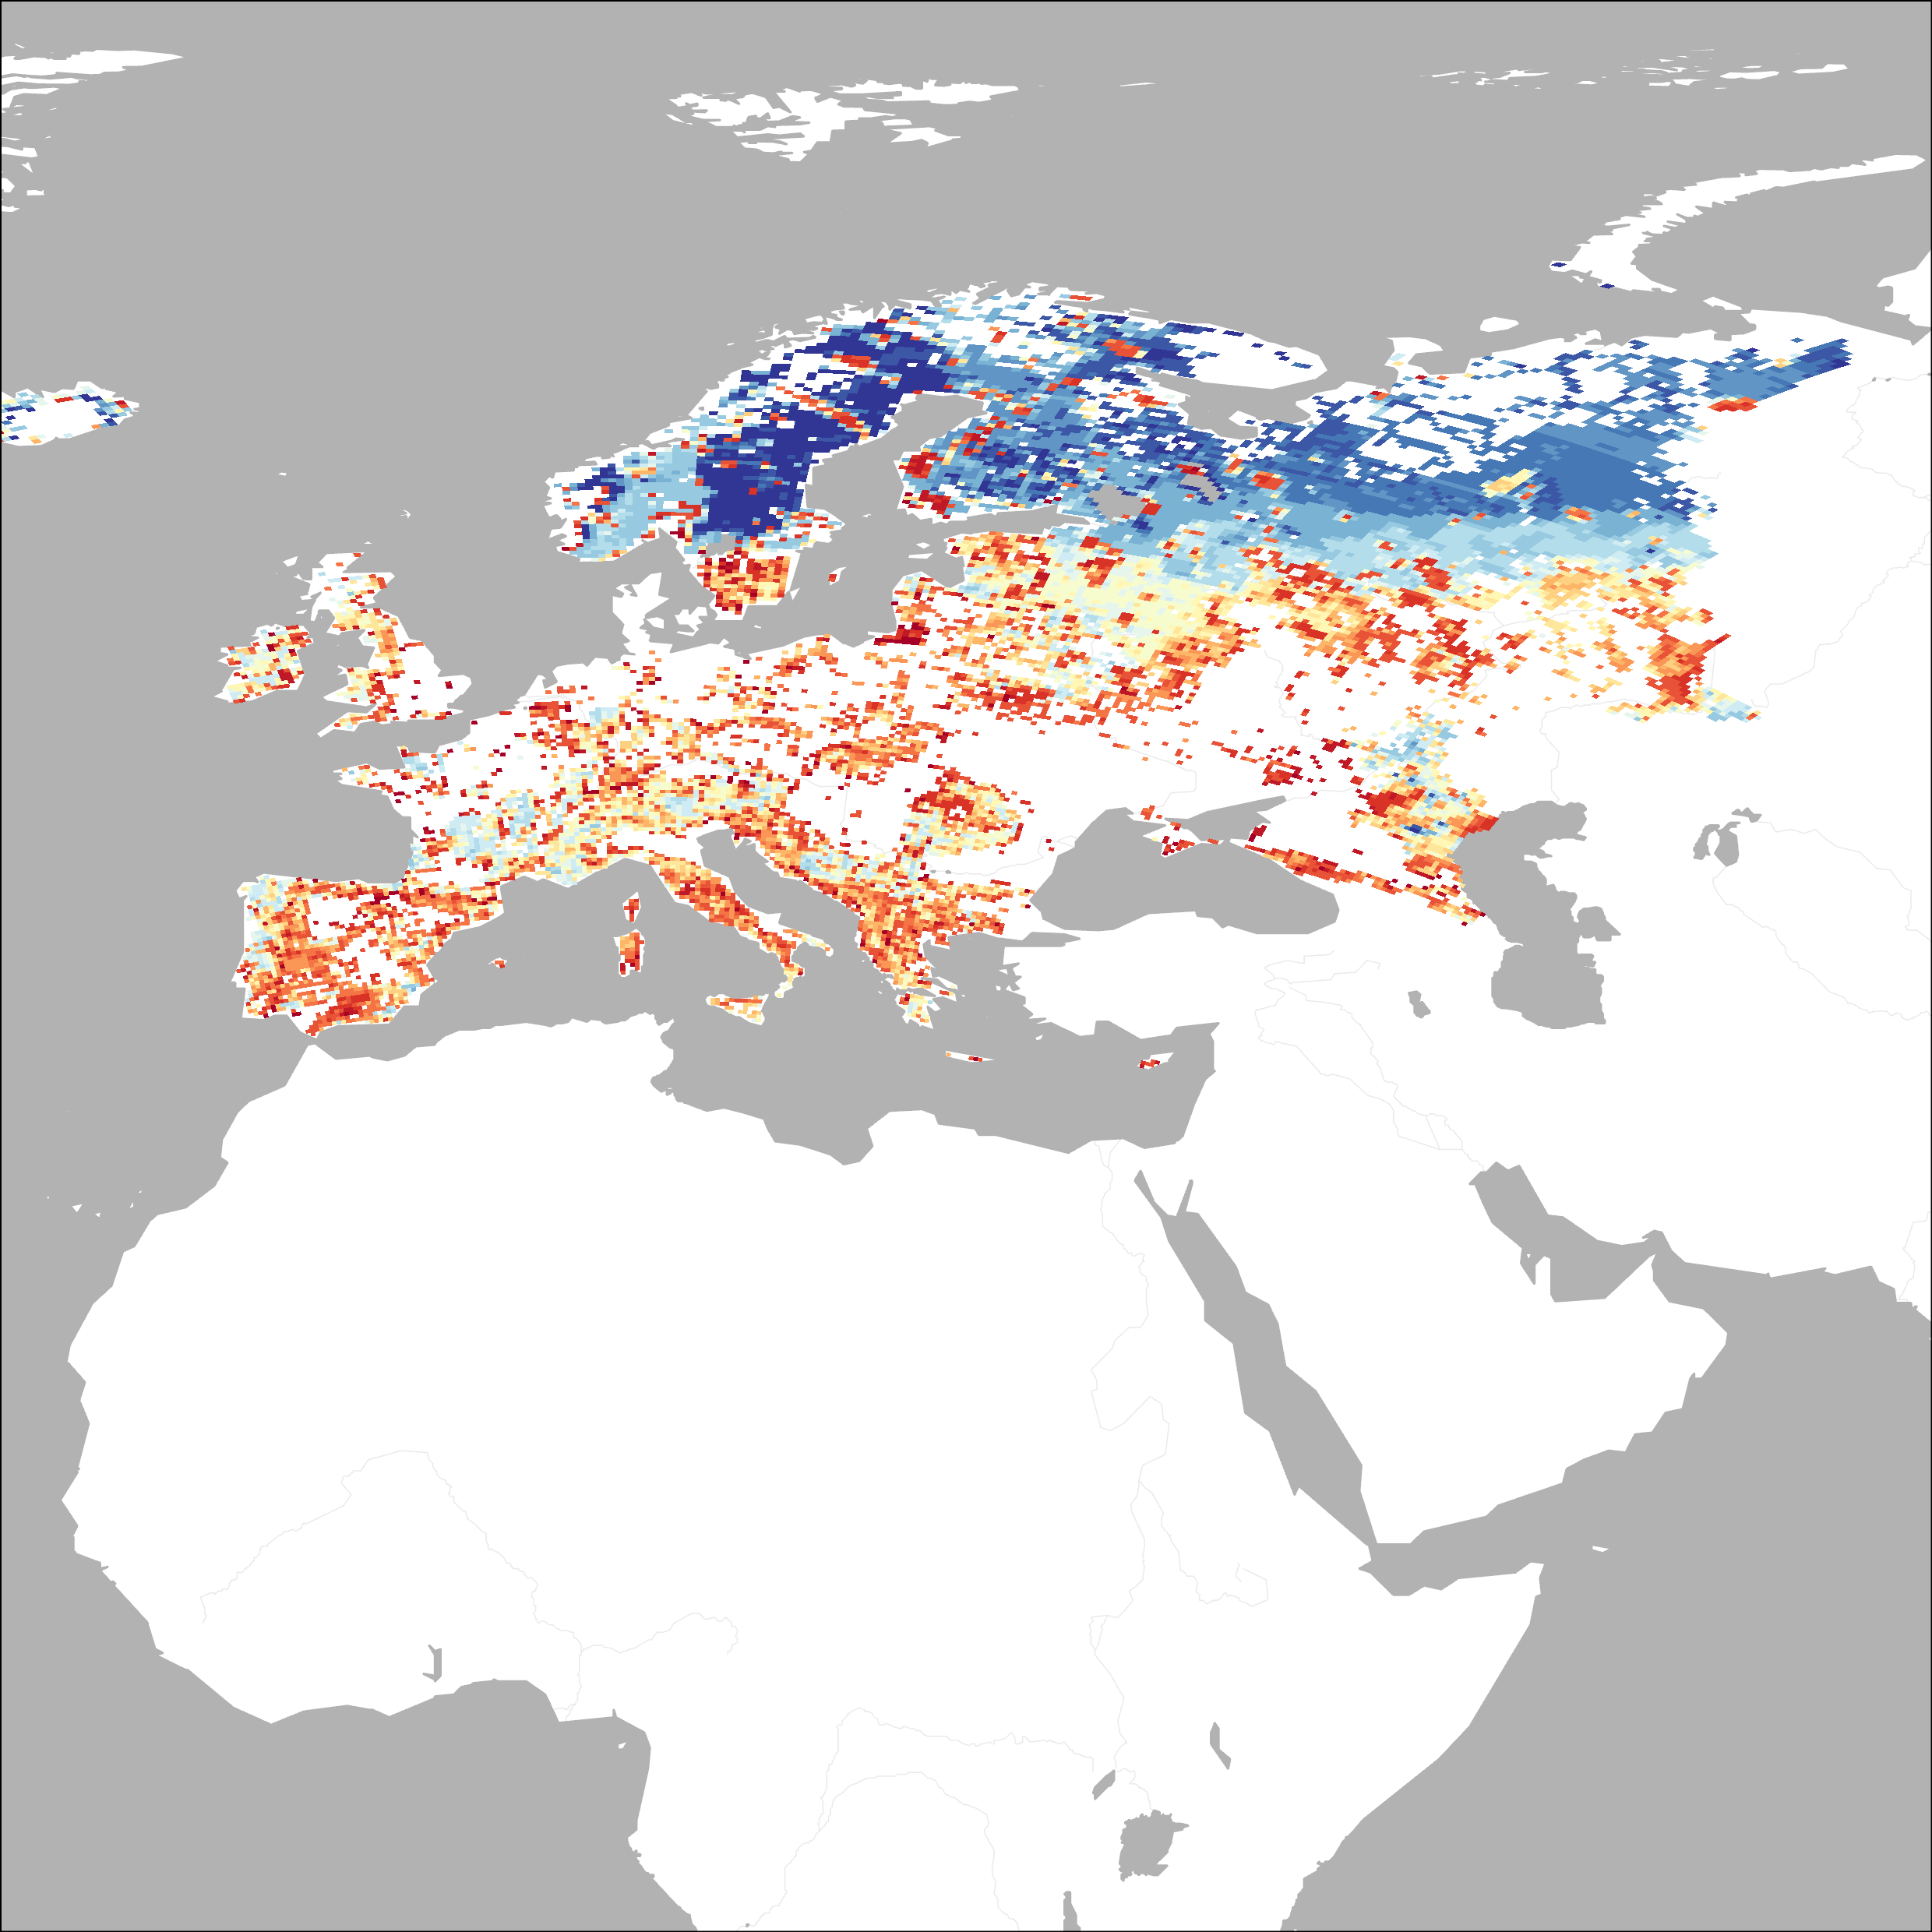
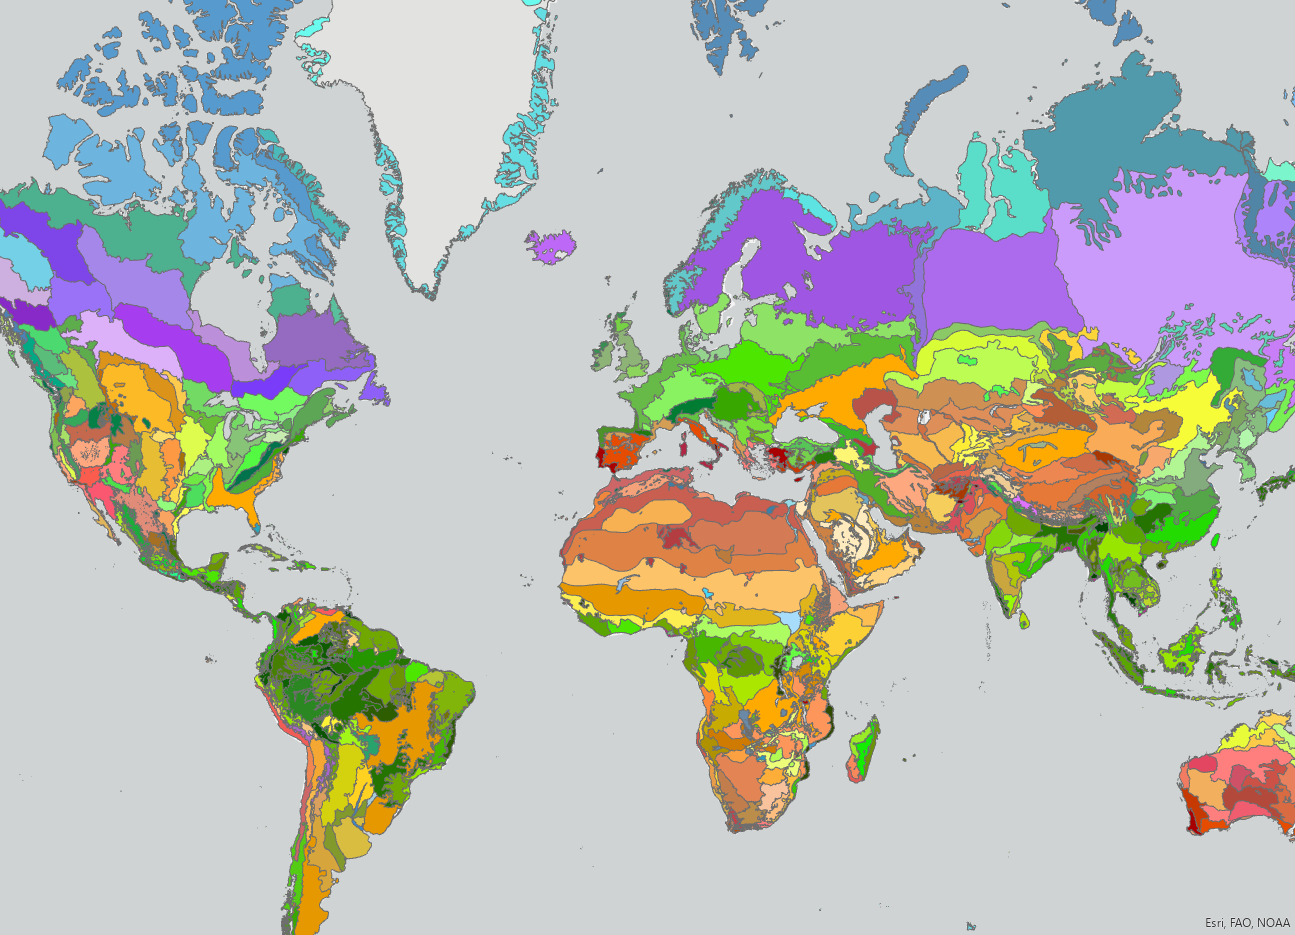
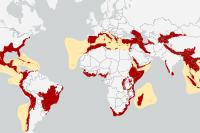
In order to describe the human pressures on the biodiversity component of nature, we used the 2009 Human Footprint (HF) map. The HF is a widely recognised dataset describing the global, cumulative human pressure on the environment in 2009, at a spatial resolution of ~1 km (Venter et al., 2016). The human pressure is measured using eight variables including built-up environments, population density, electric power infrastructure, crop lands, pasture lands, roads, railways, and navigable waterways. For water pressure a human footprint on water quality (% contamination) was modelled using the Waterworld version 2 policy support system.
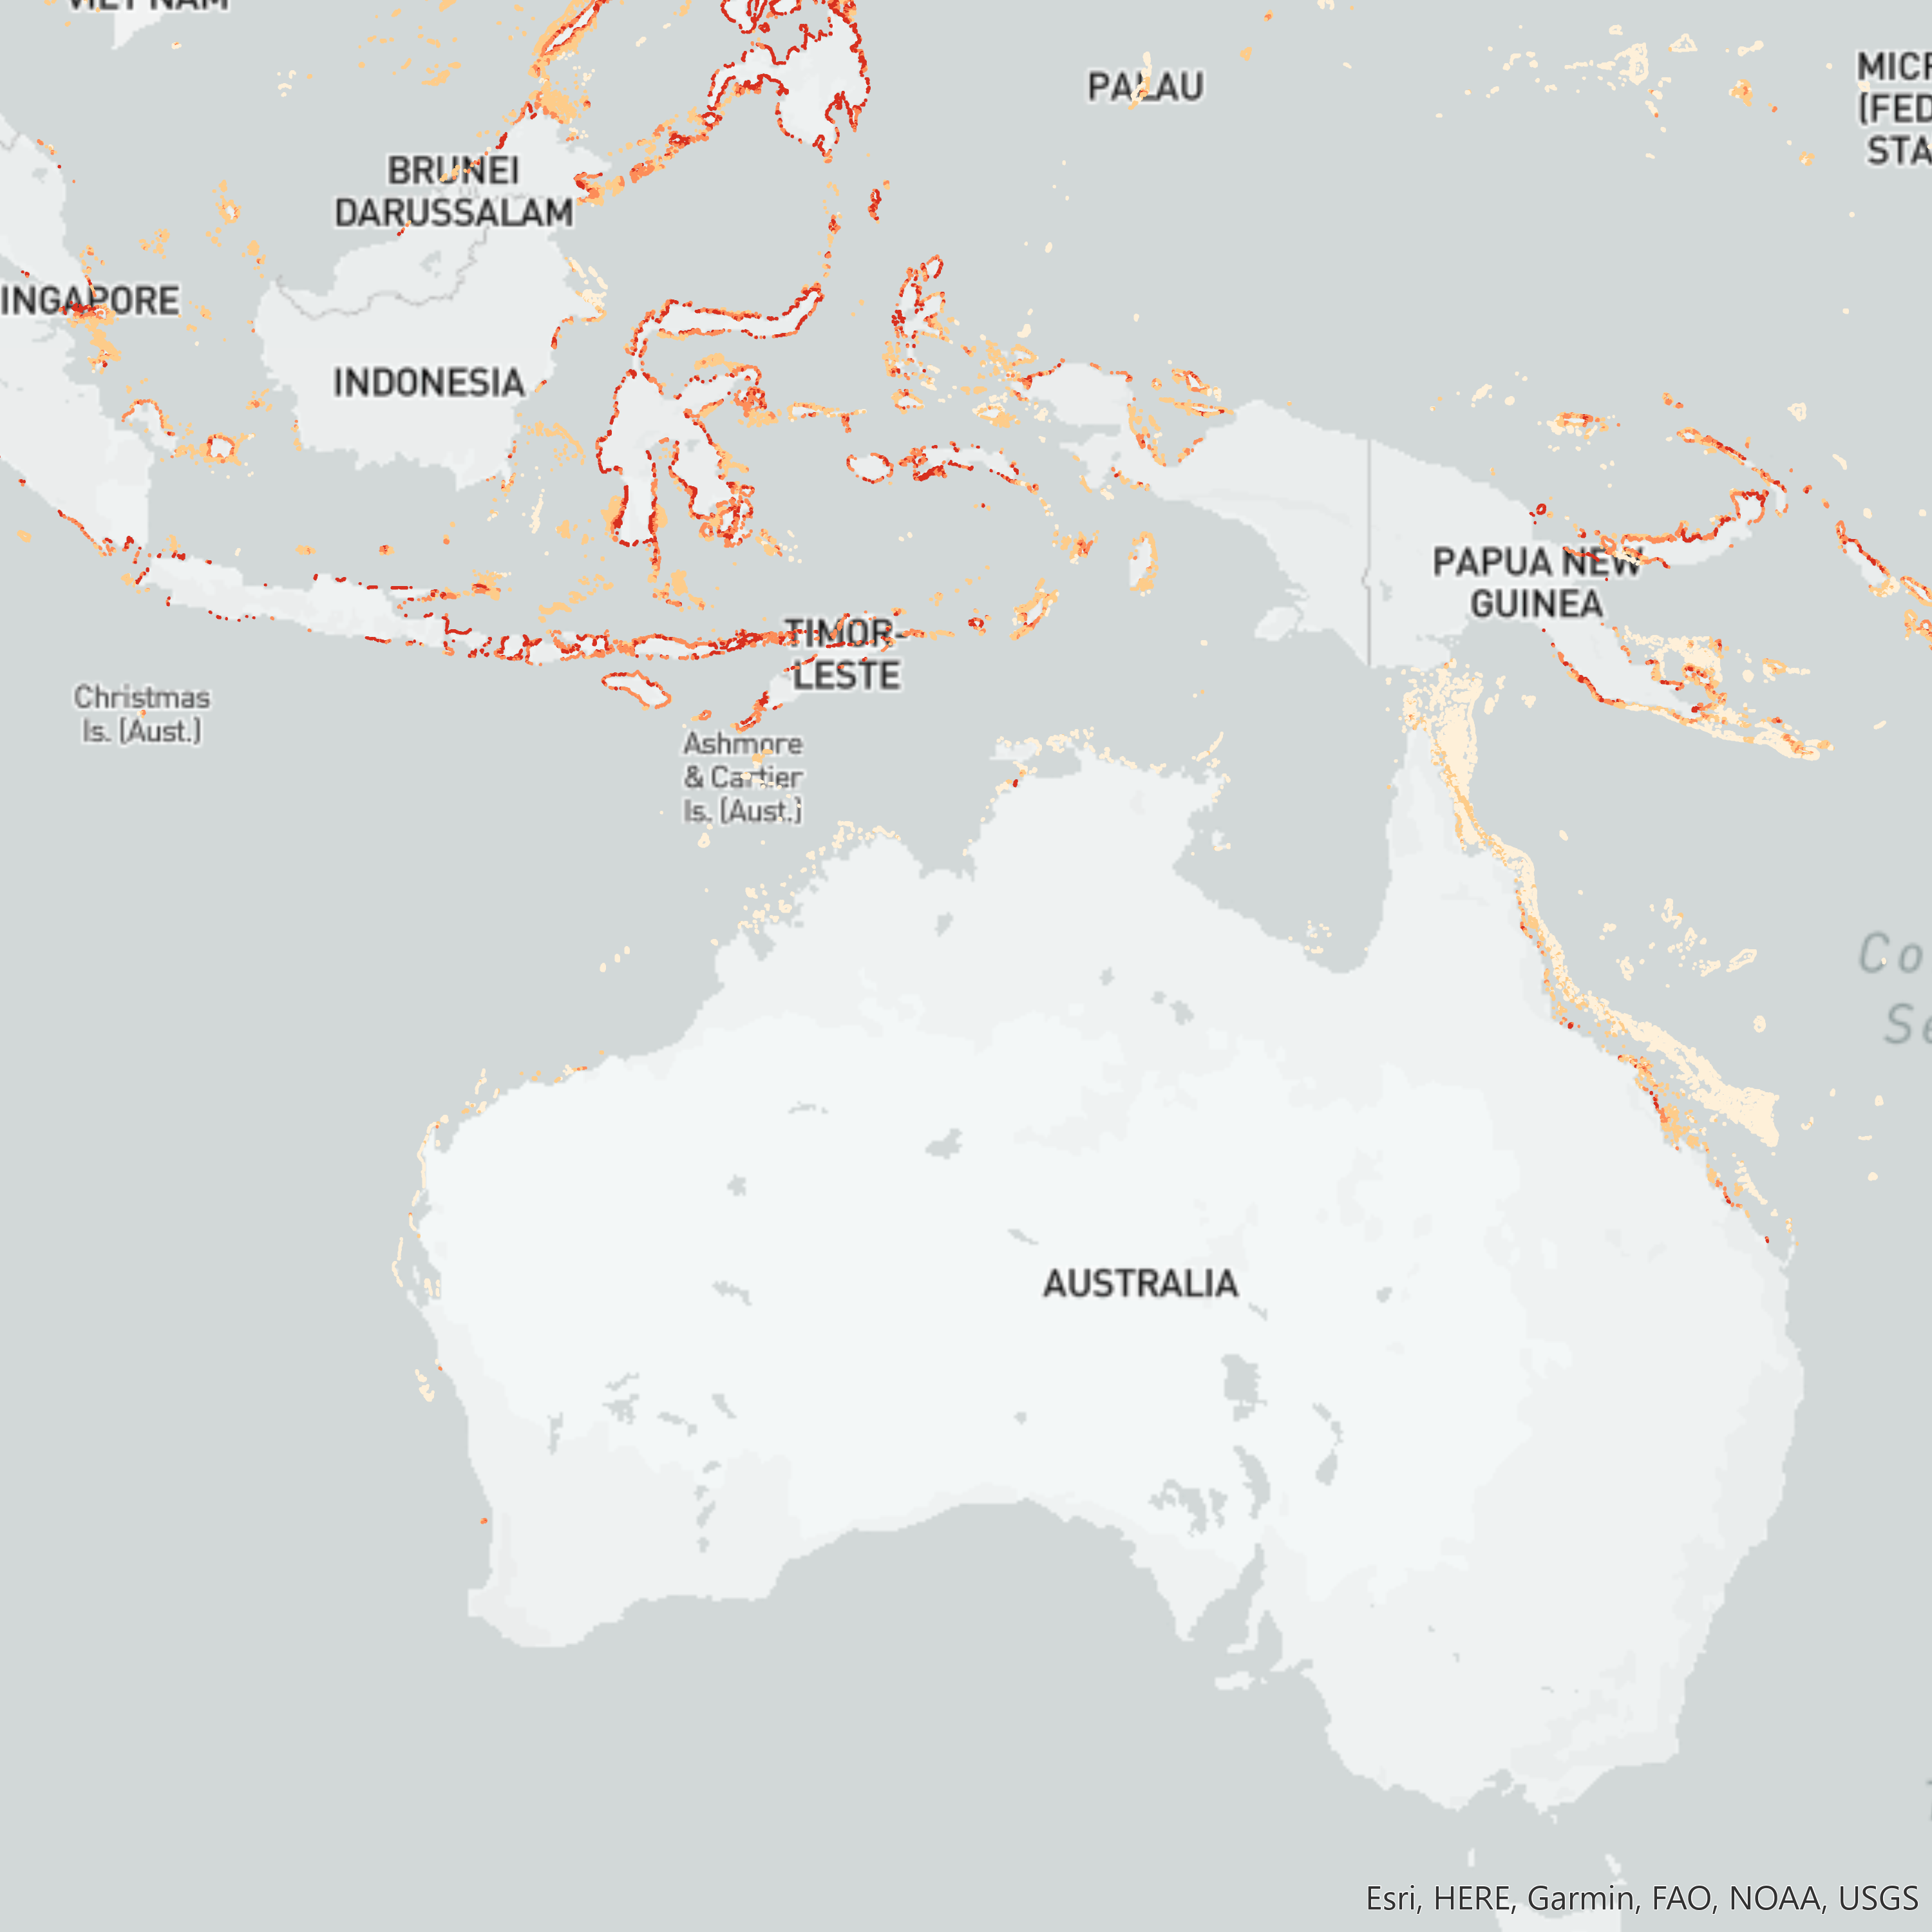
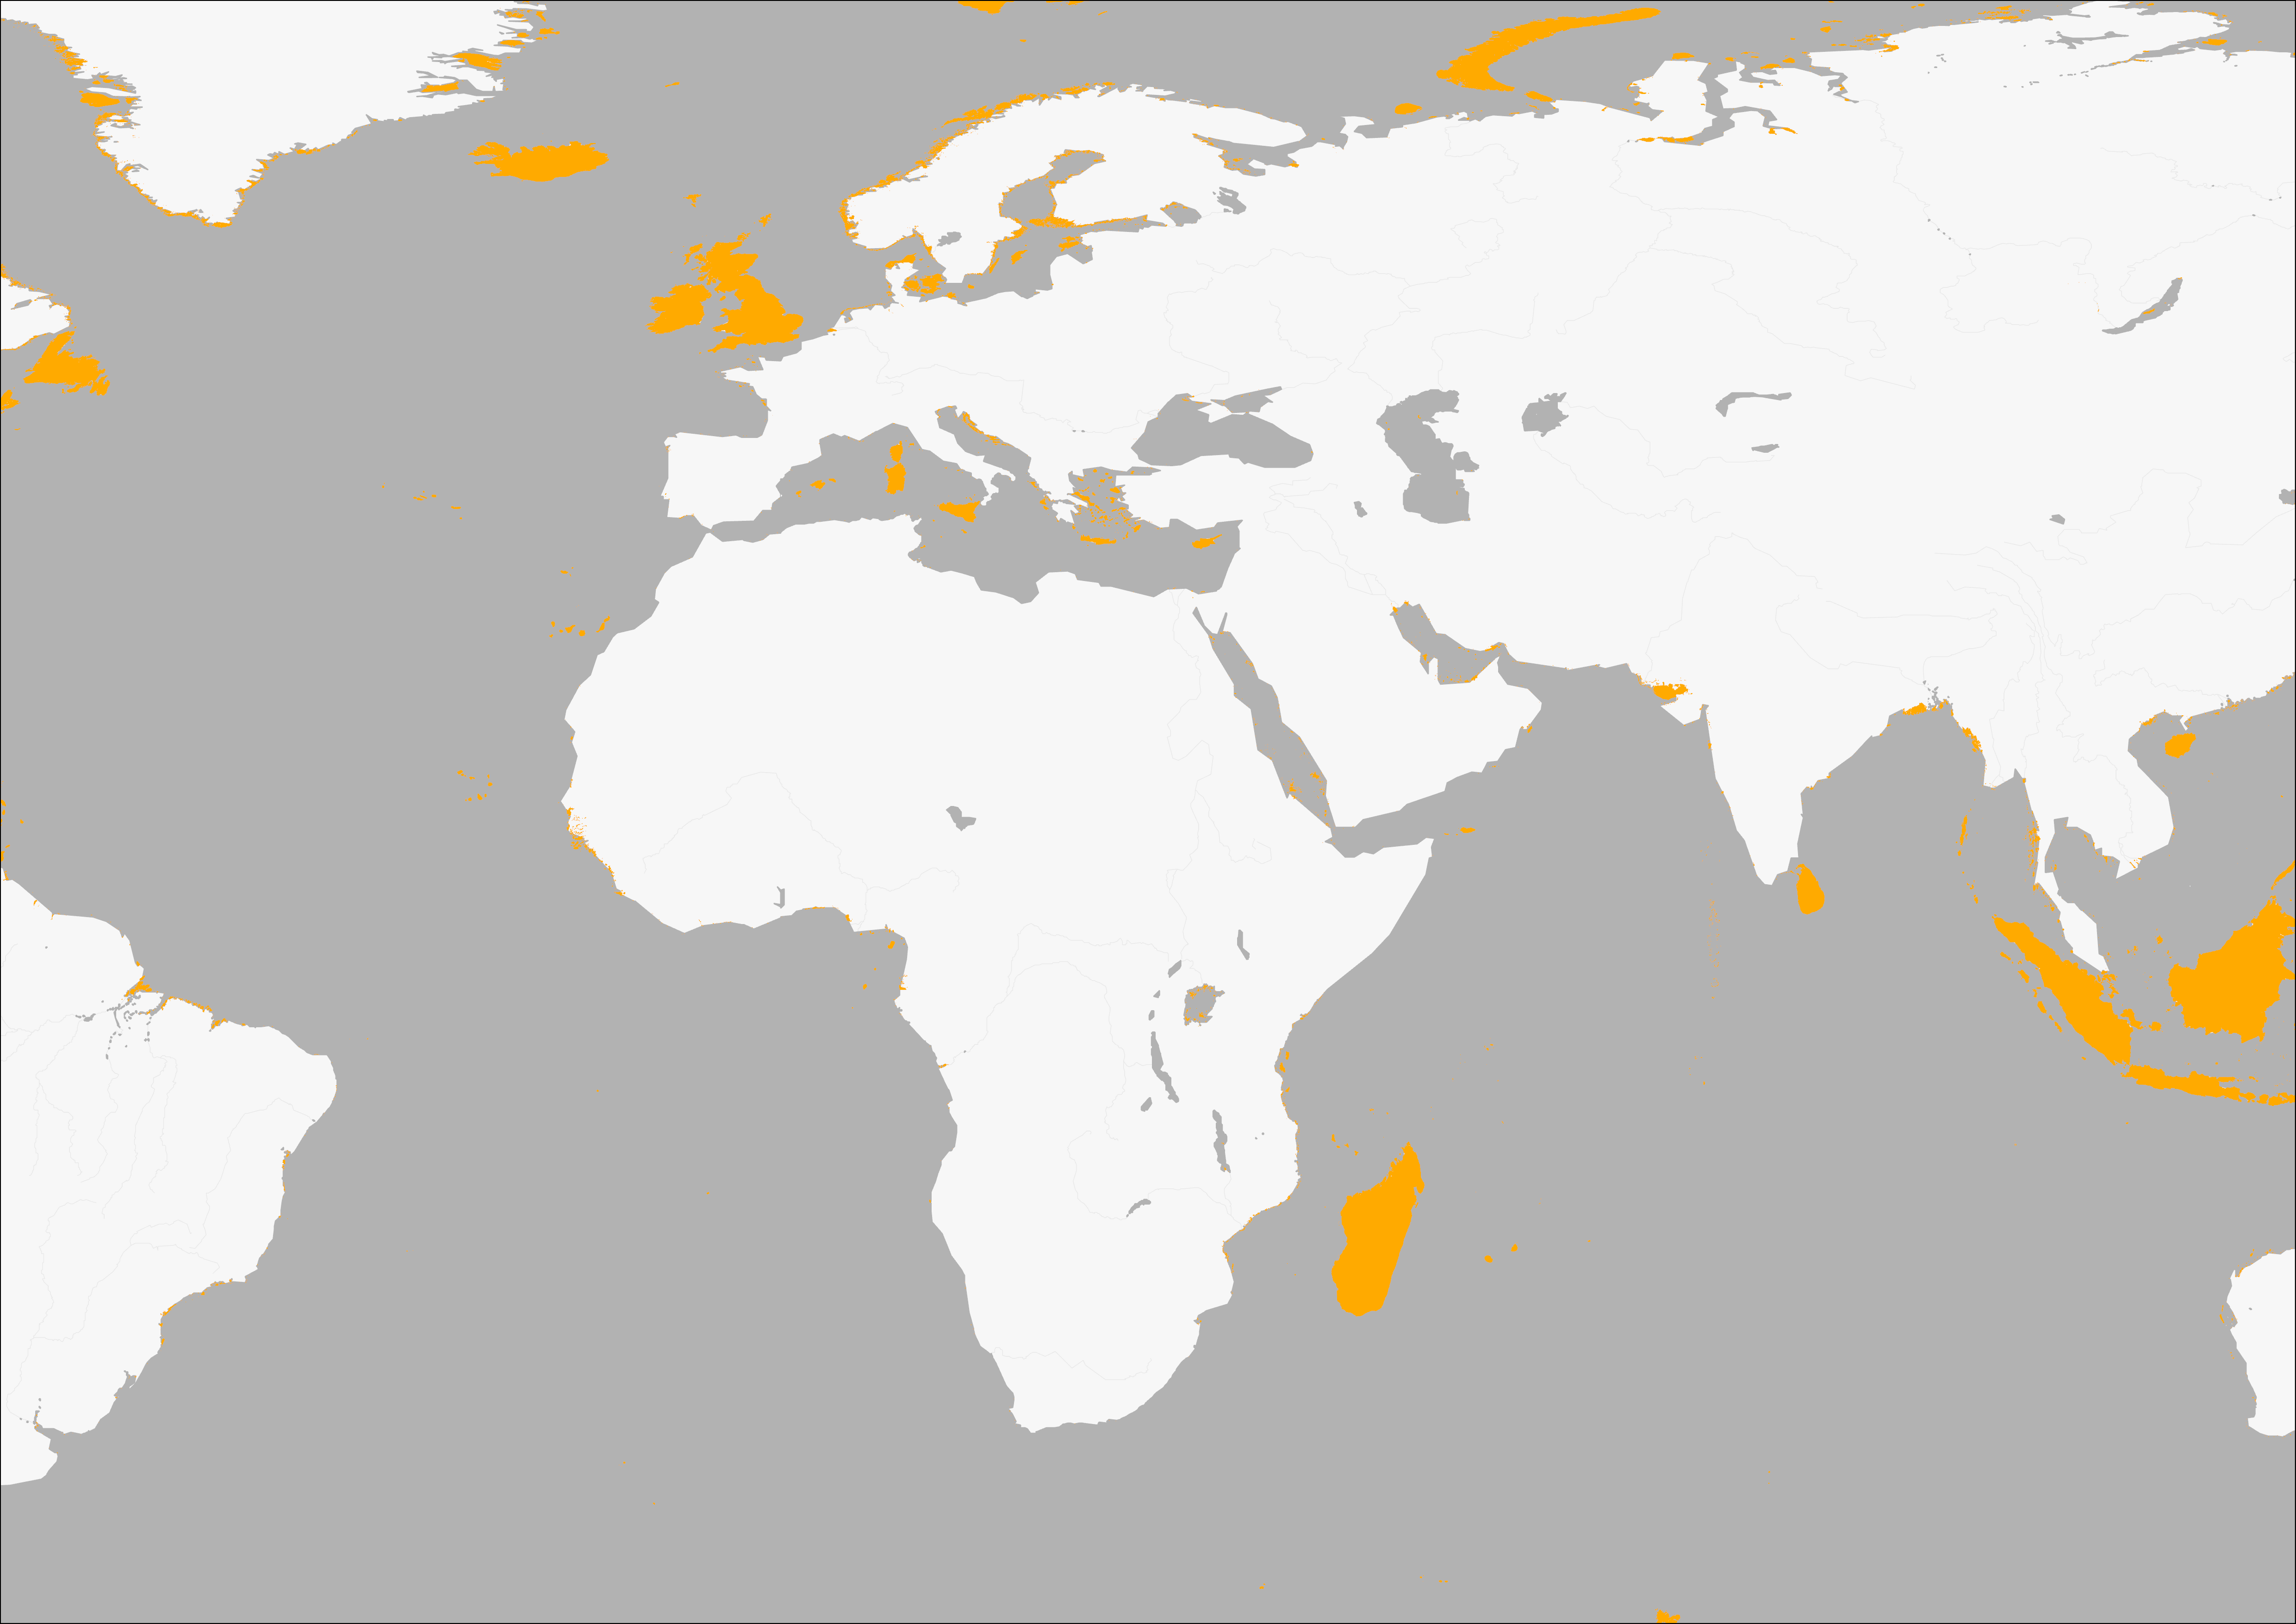
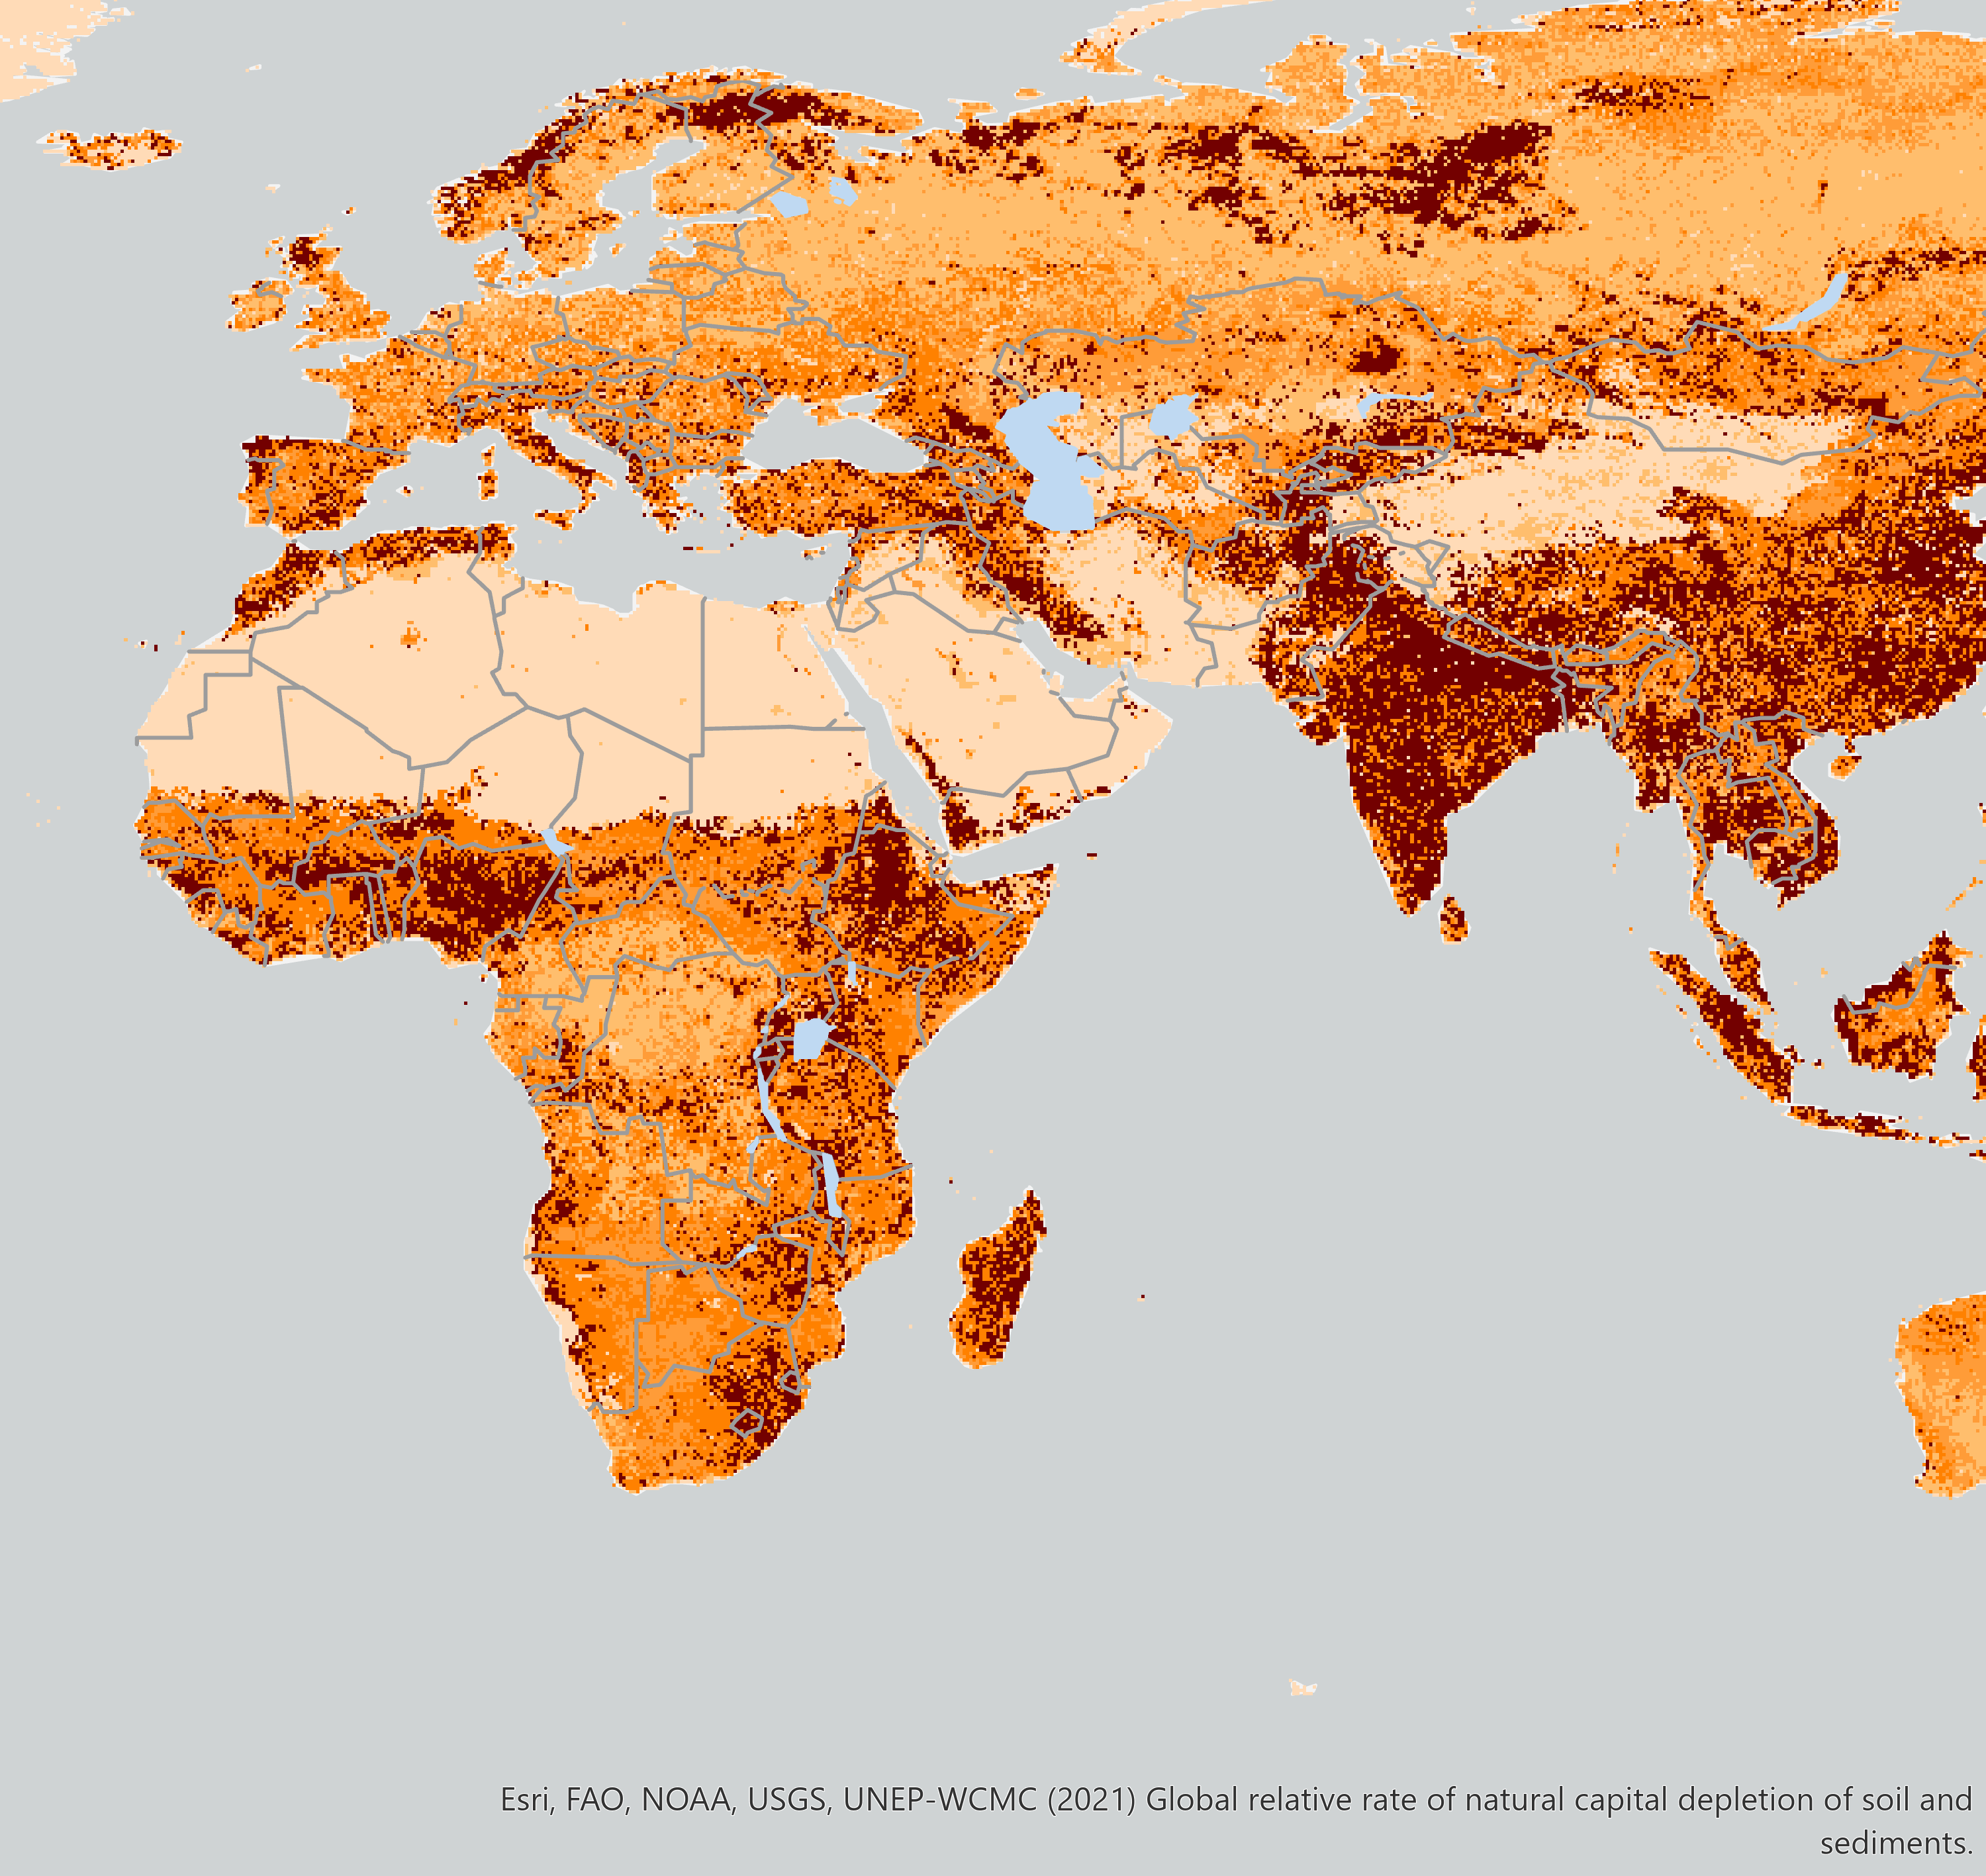
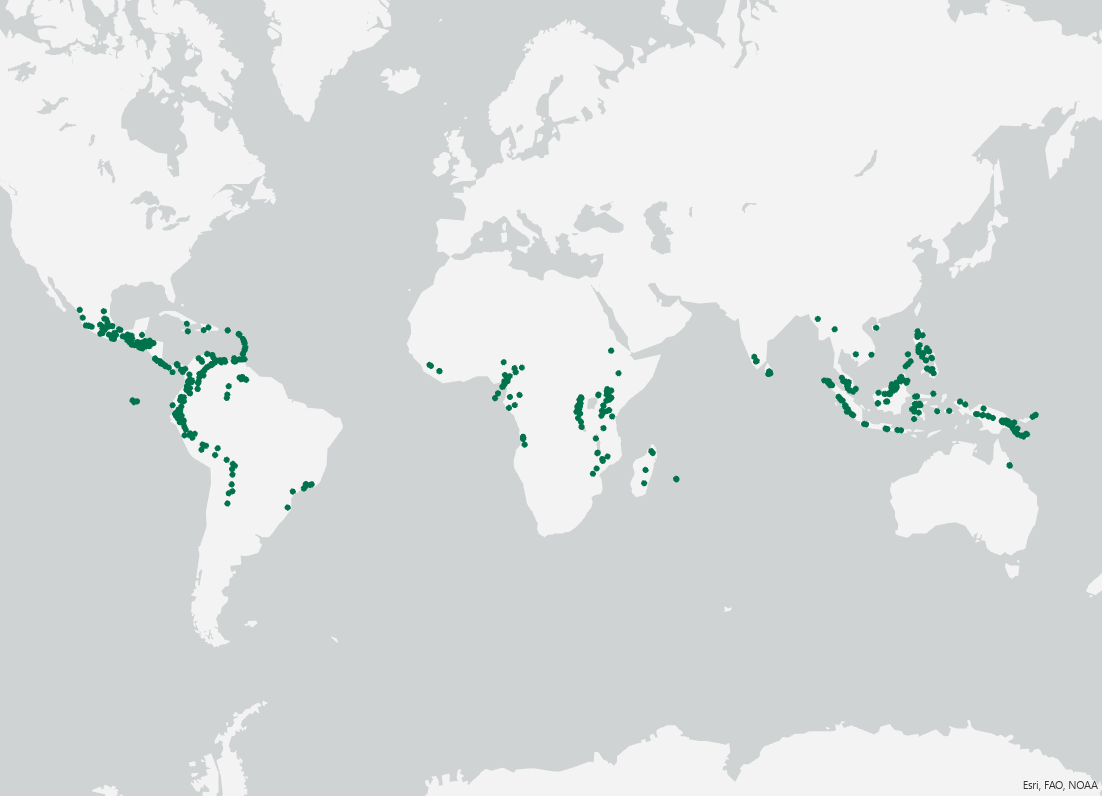
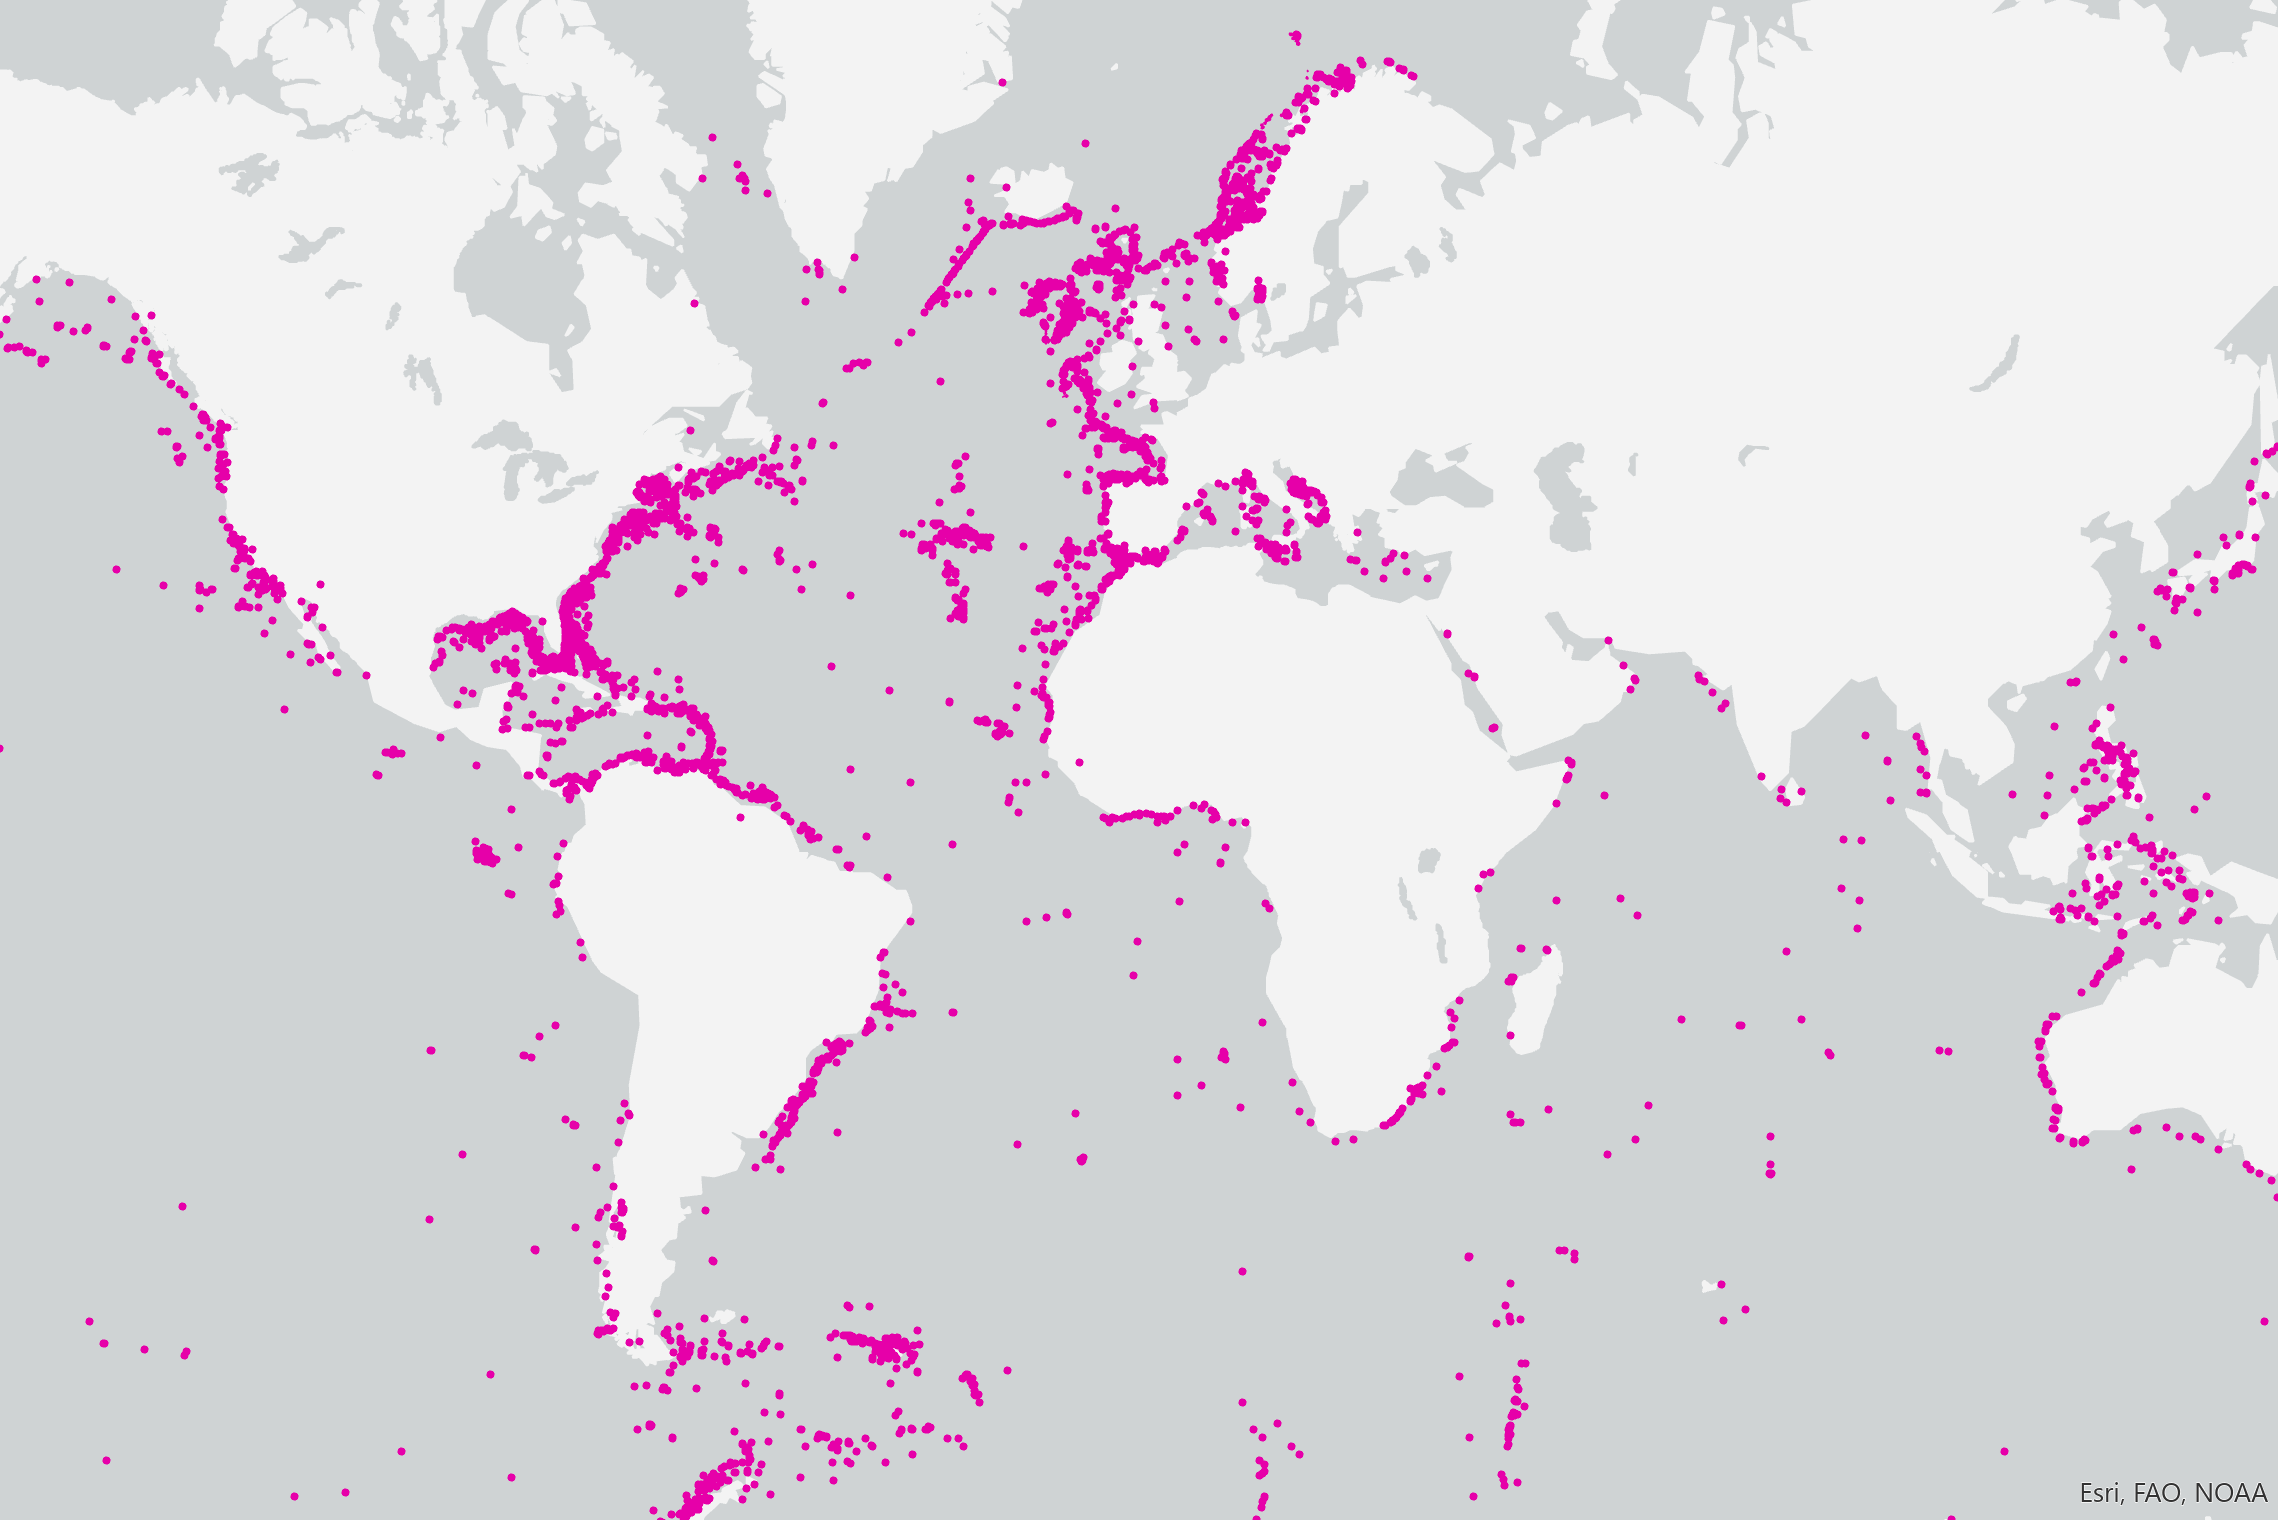
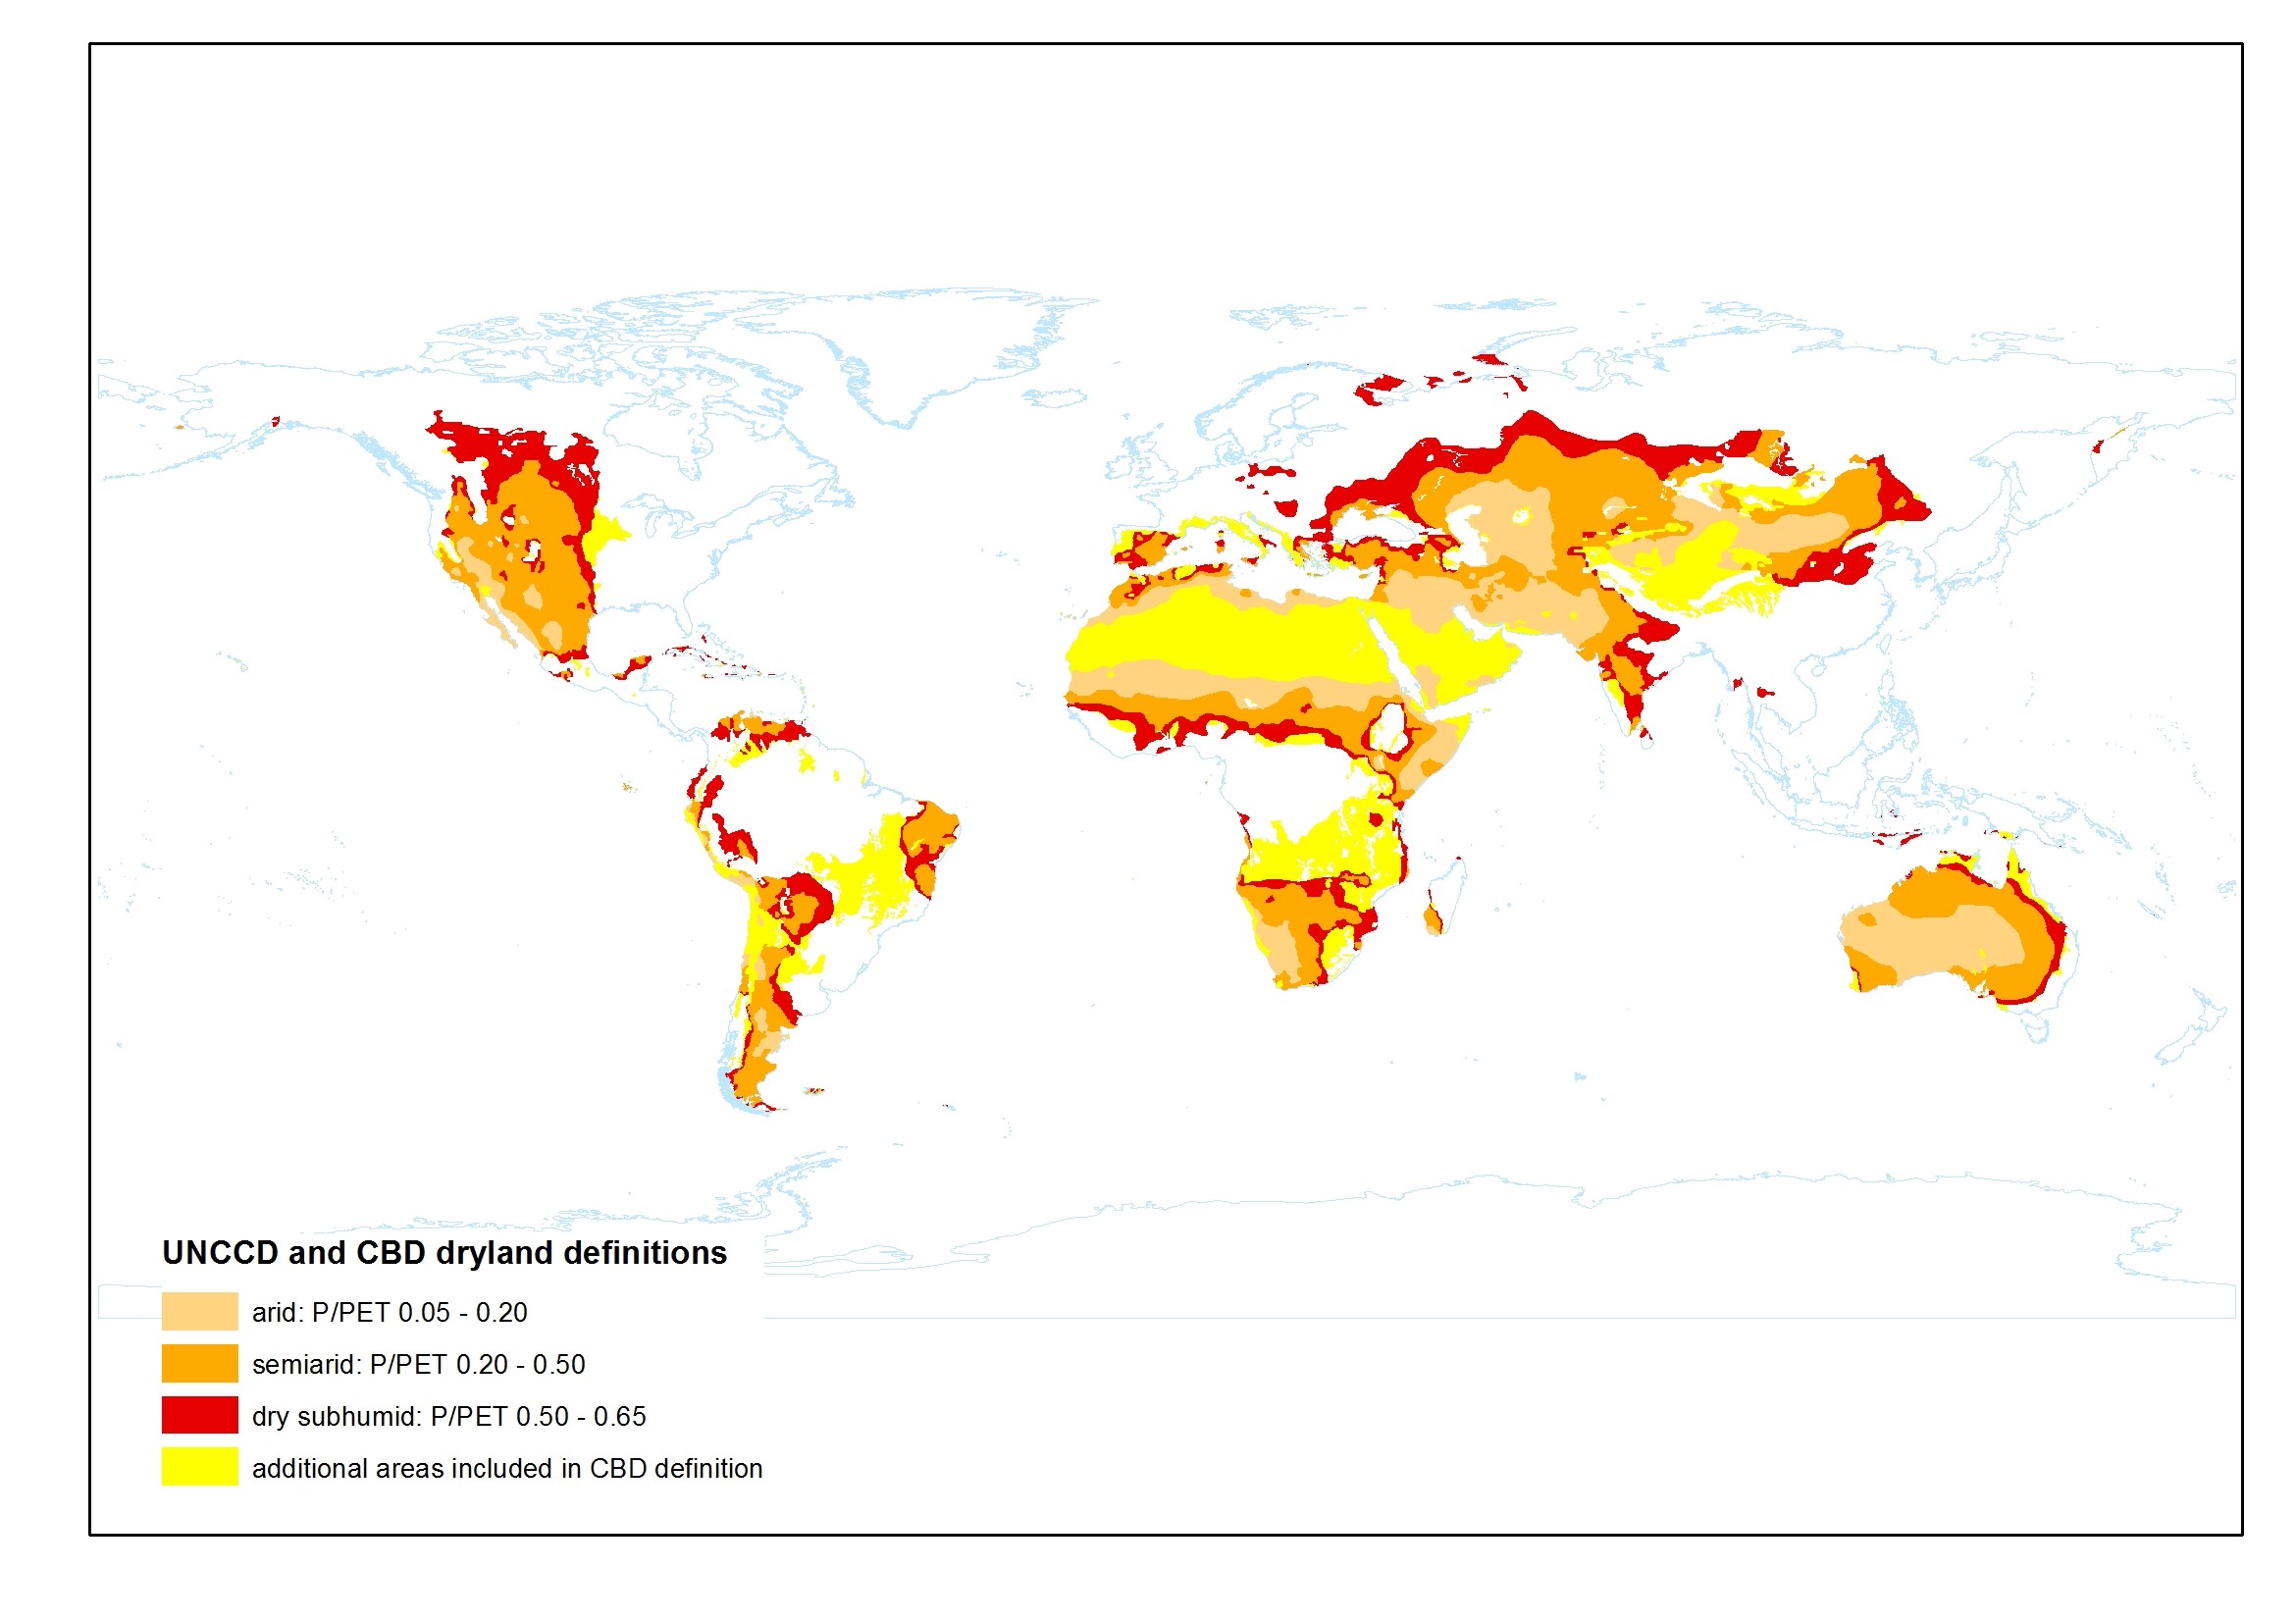
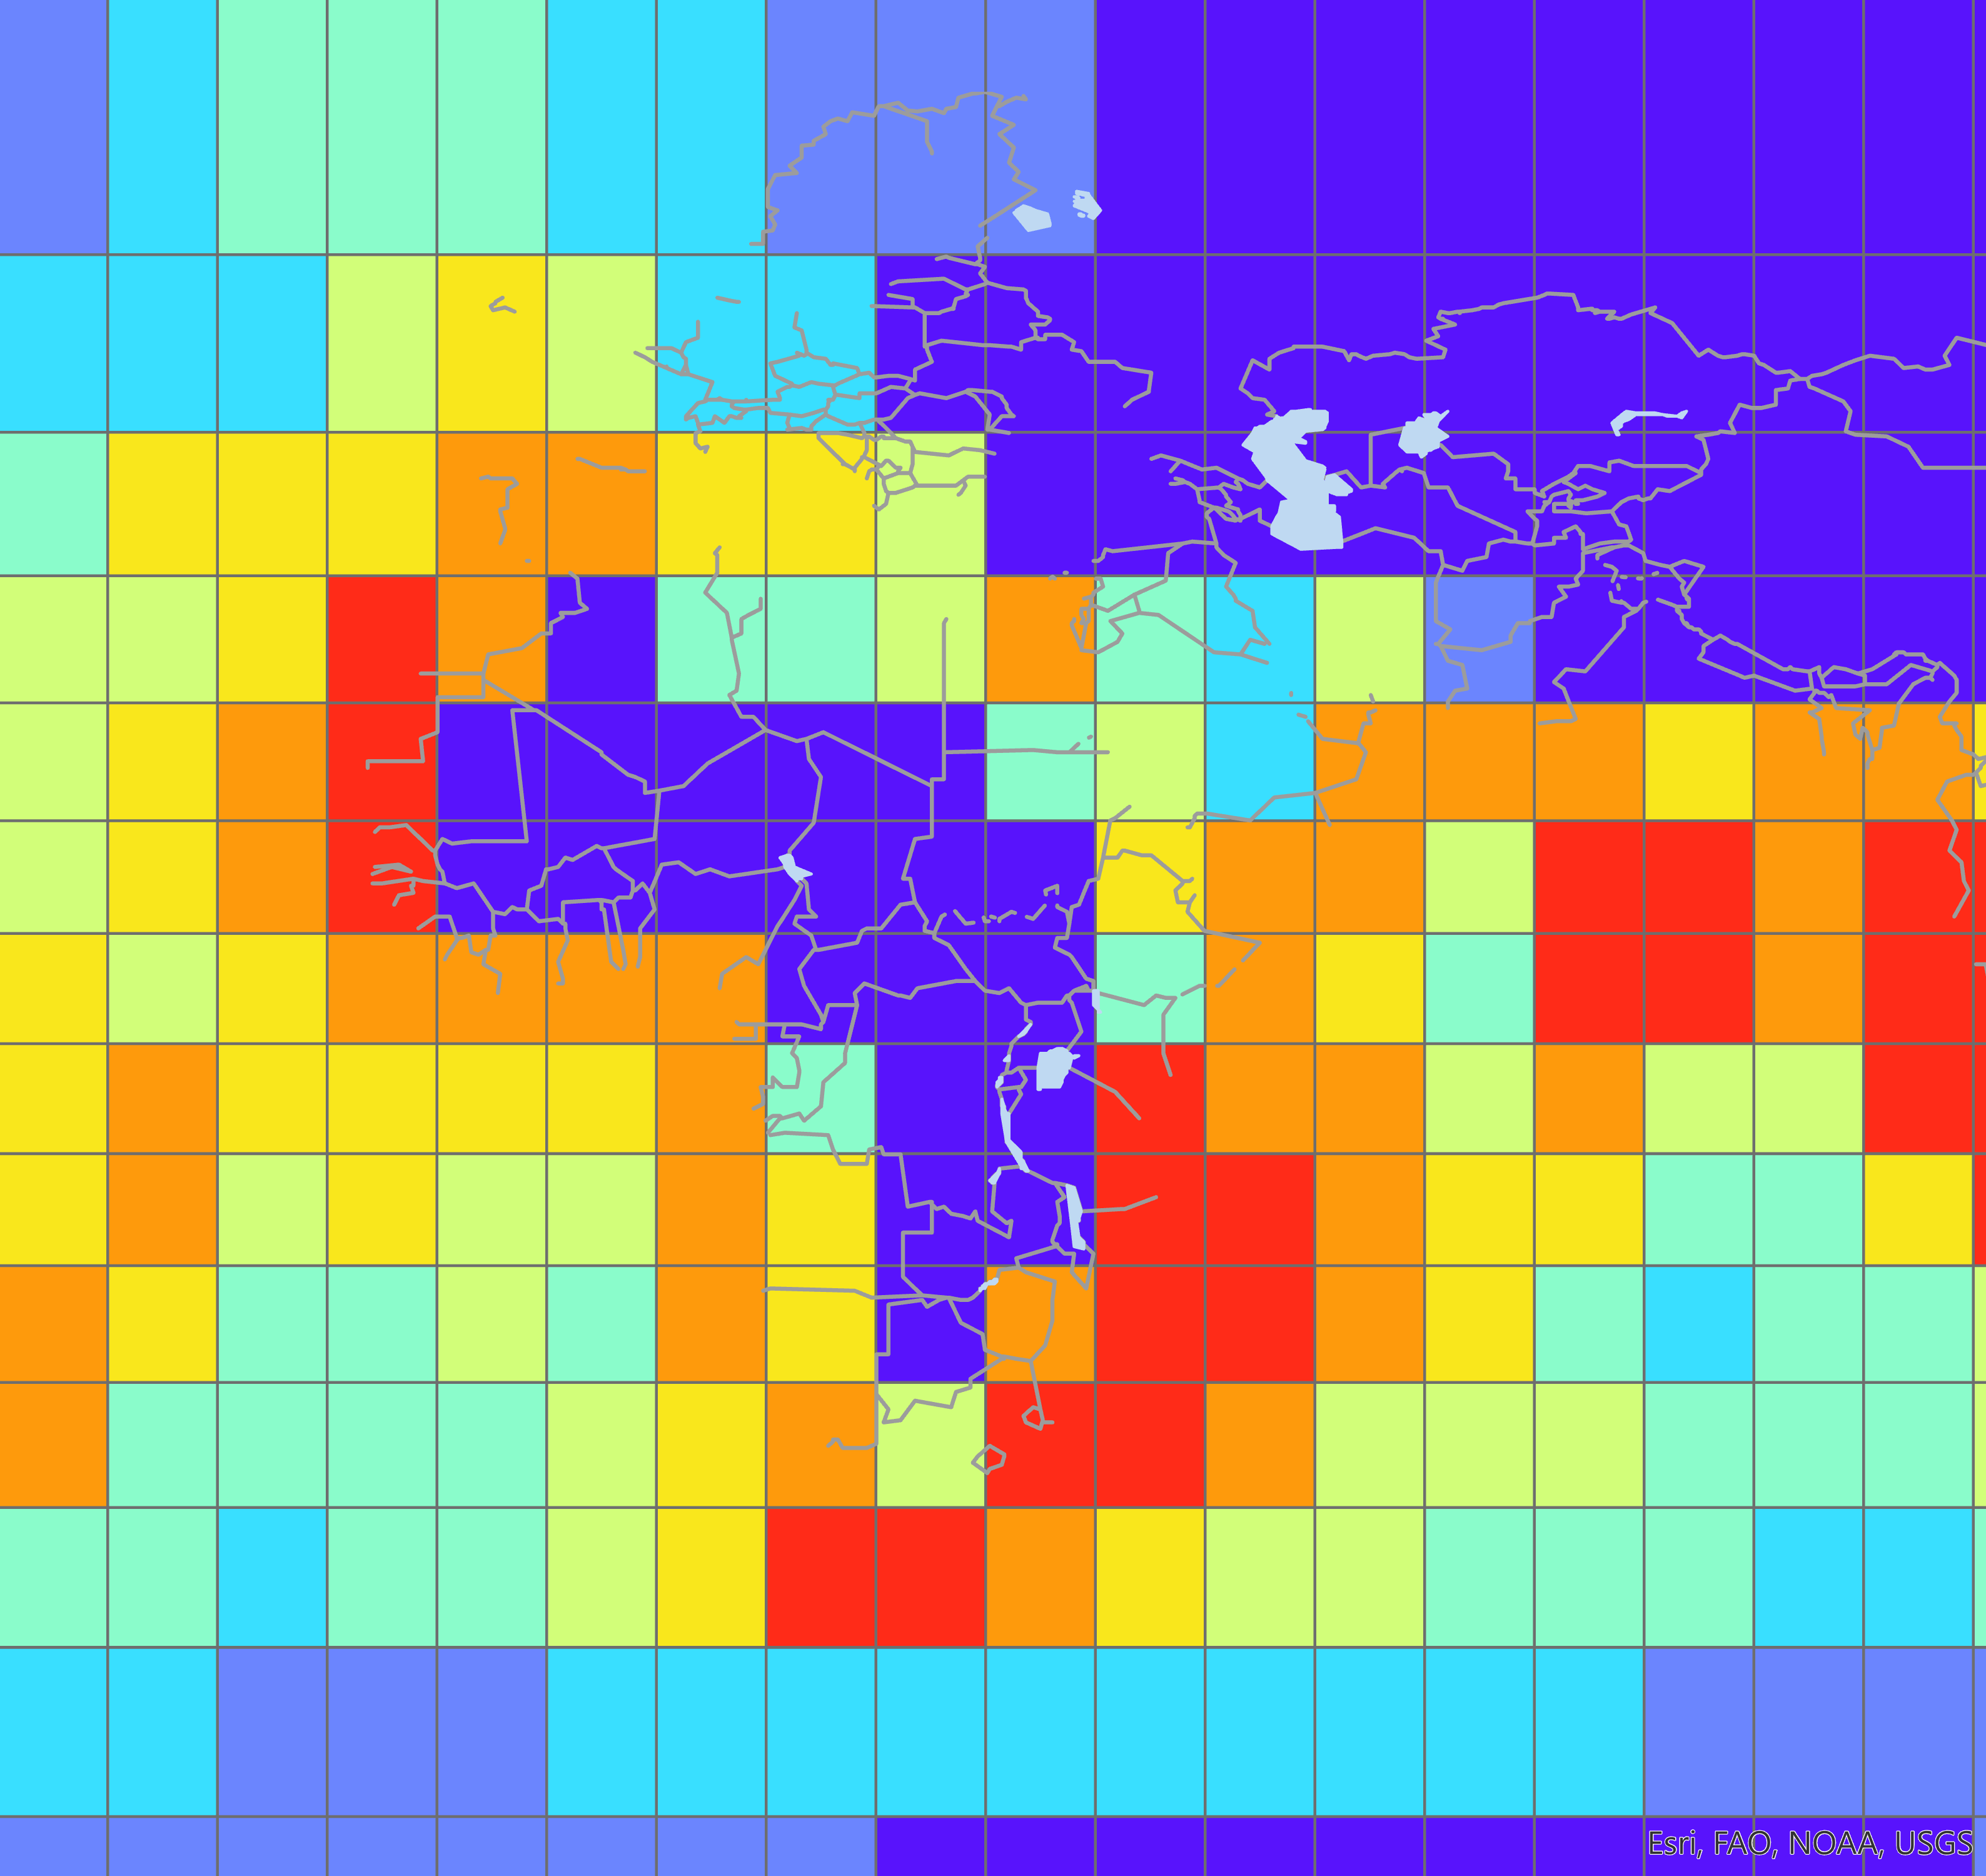
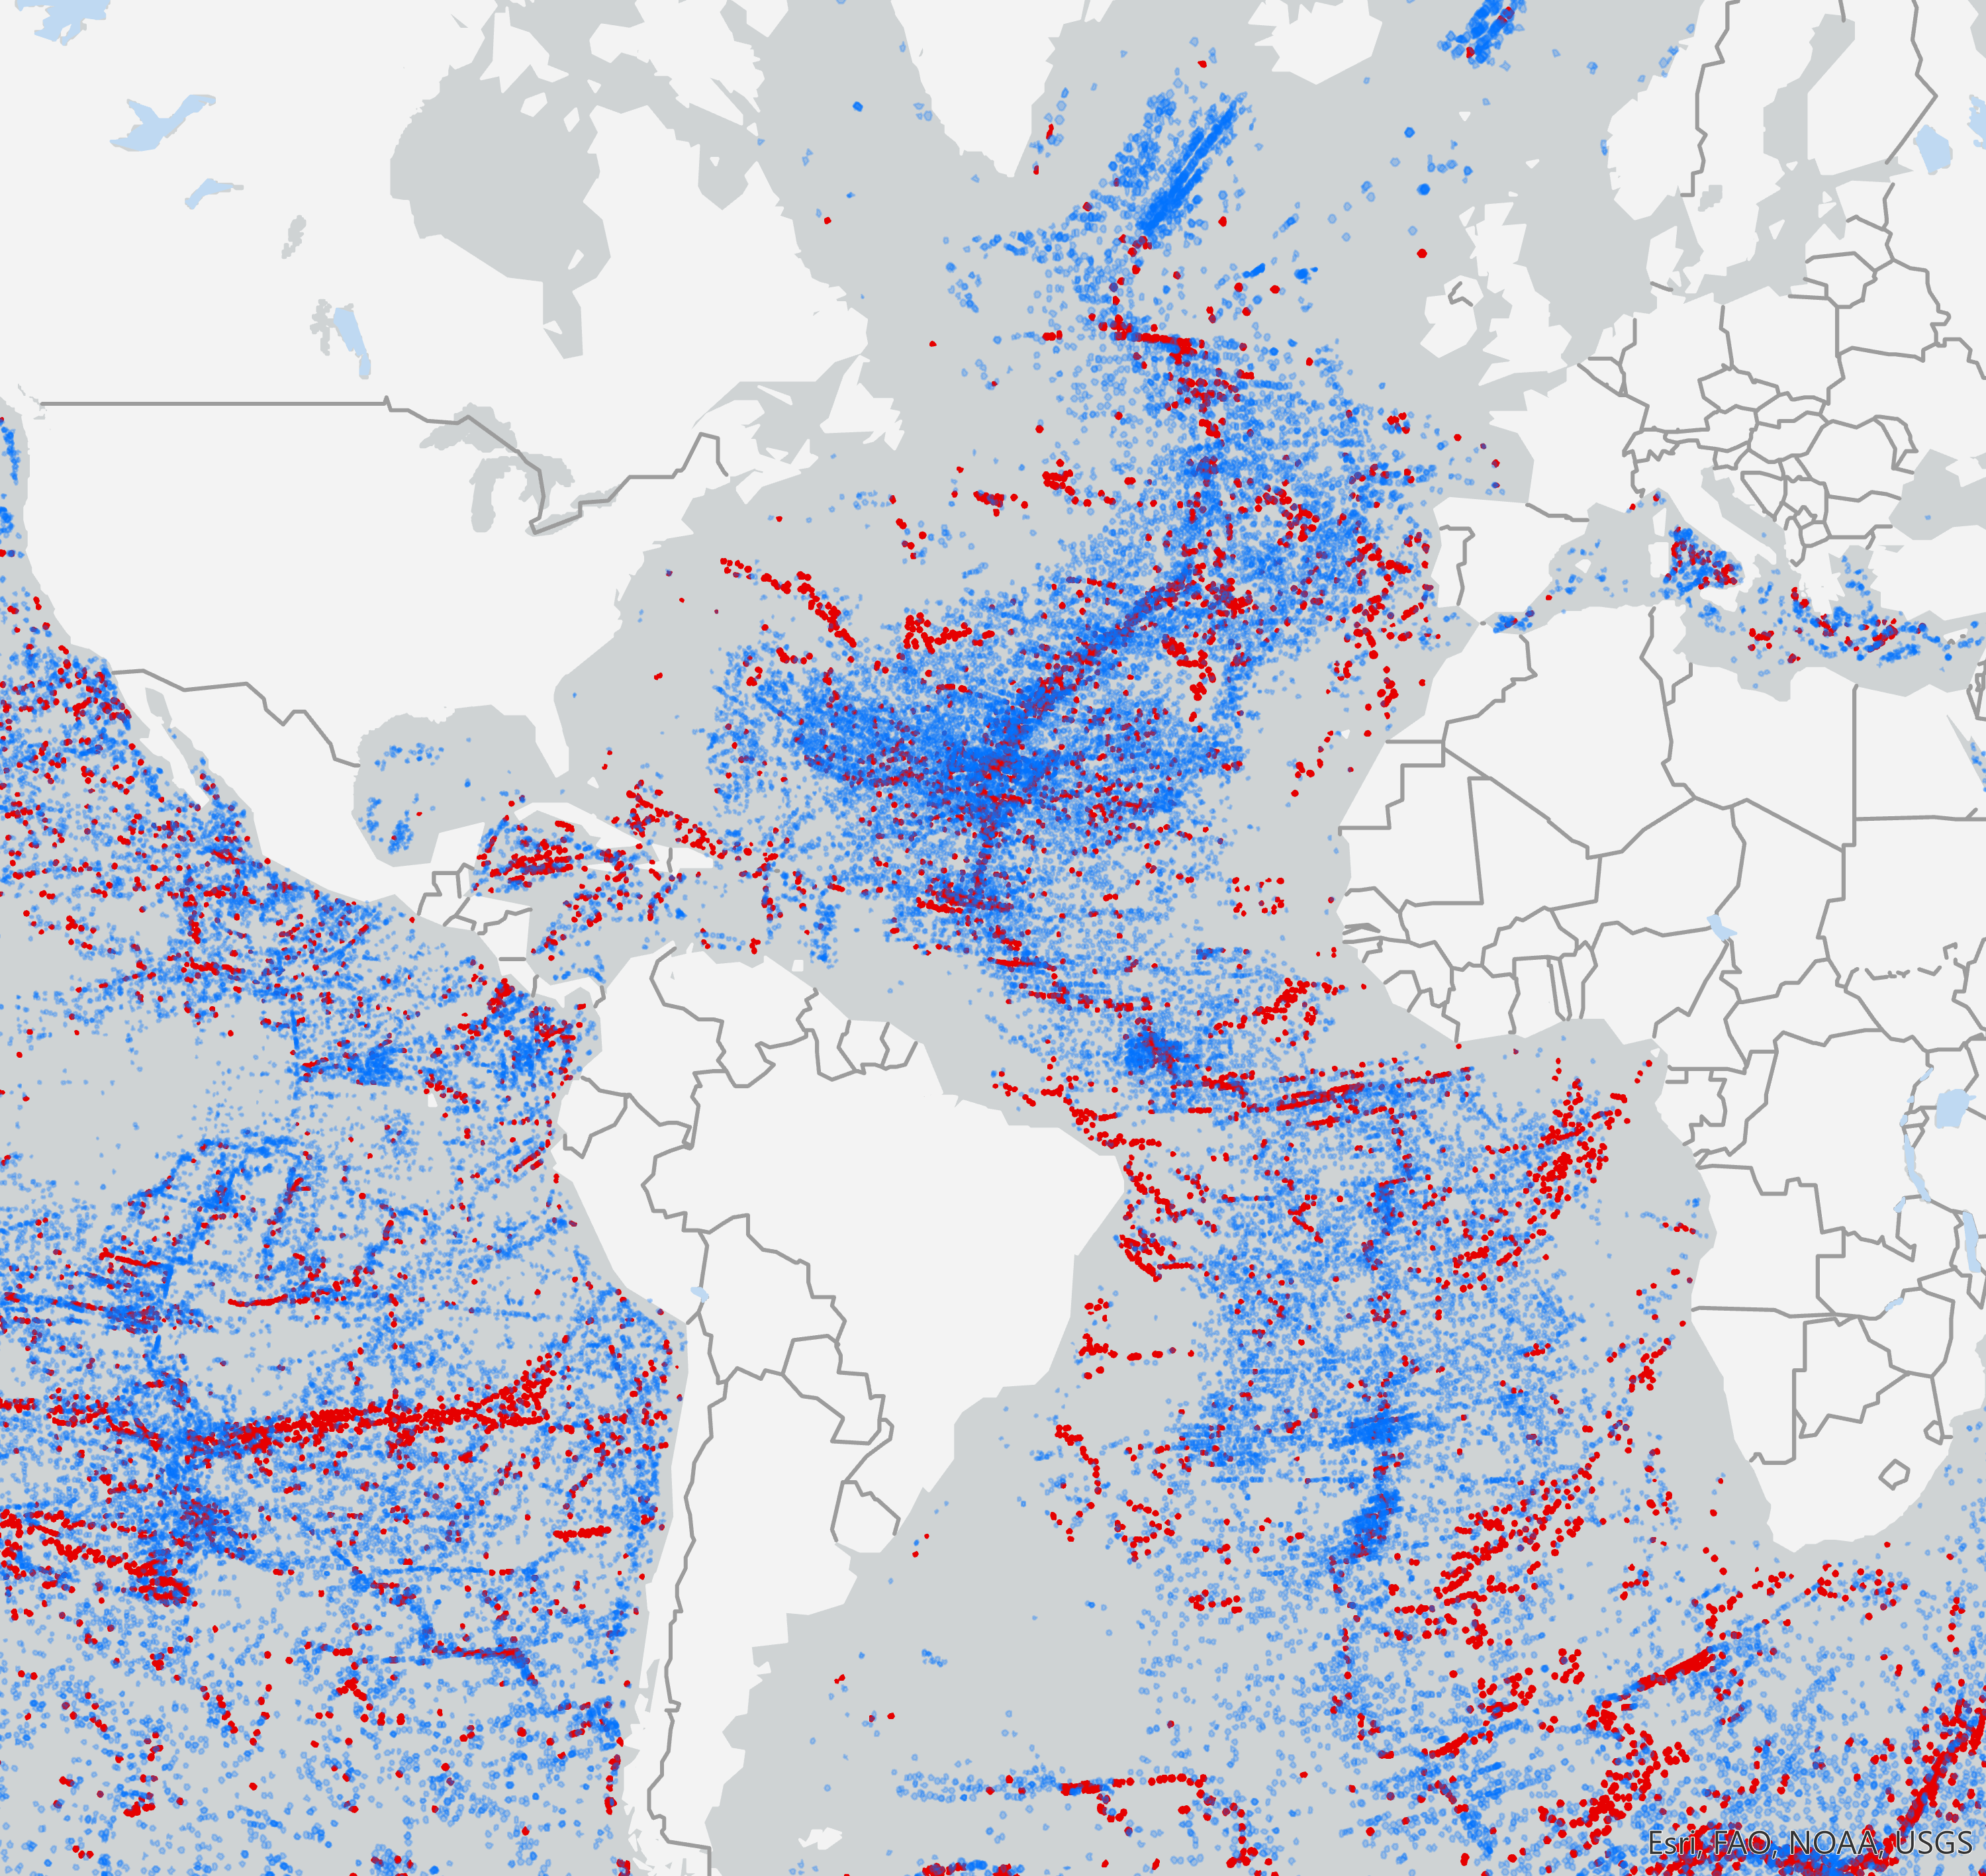
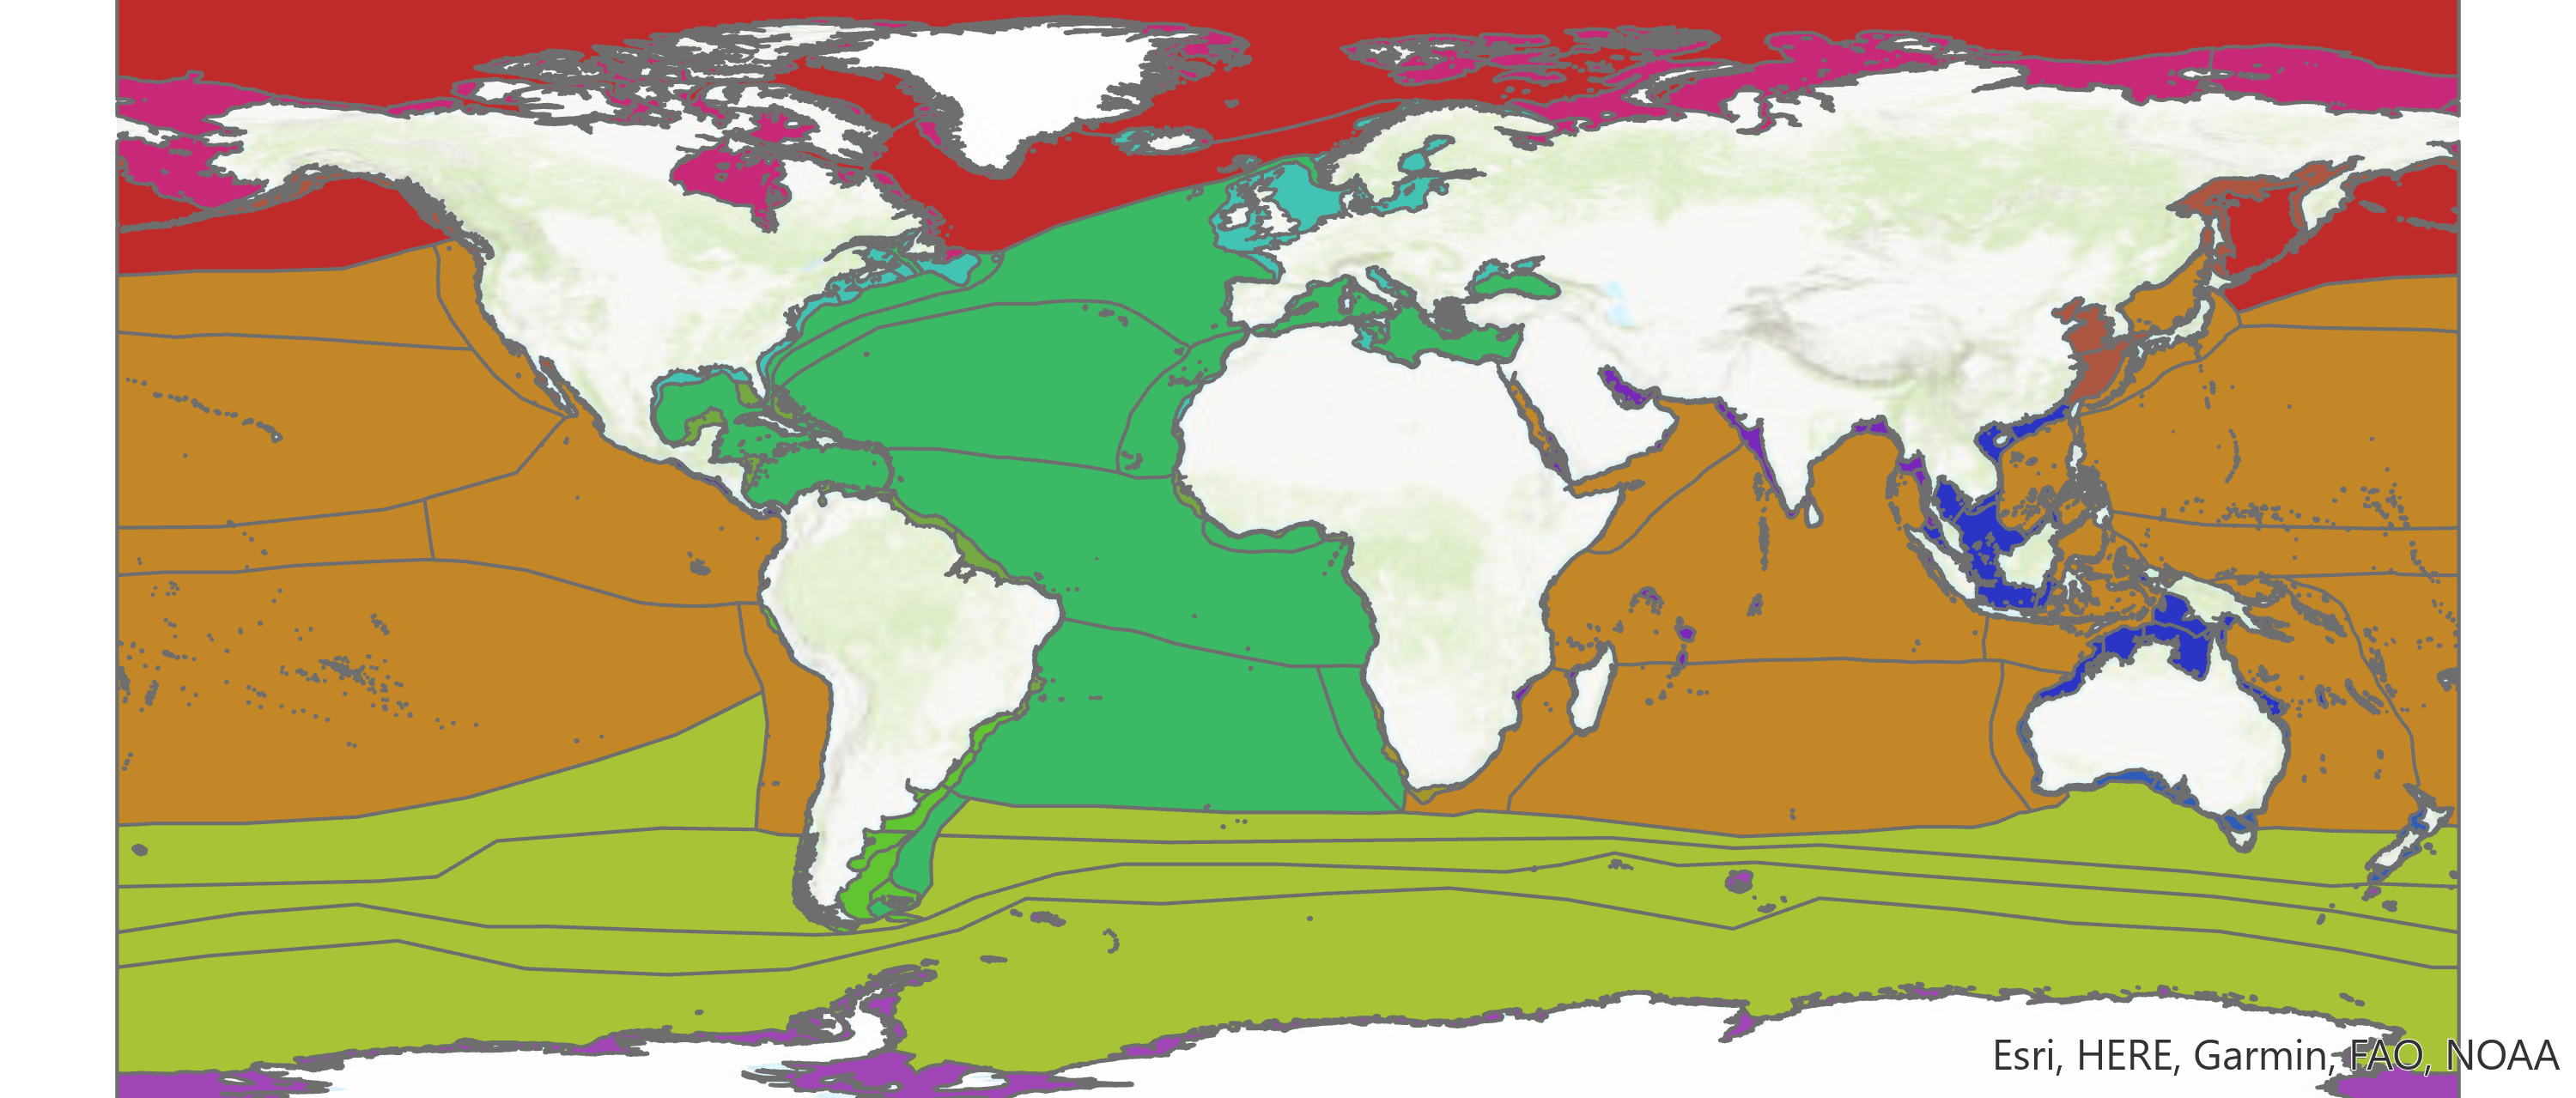
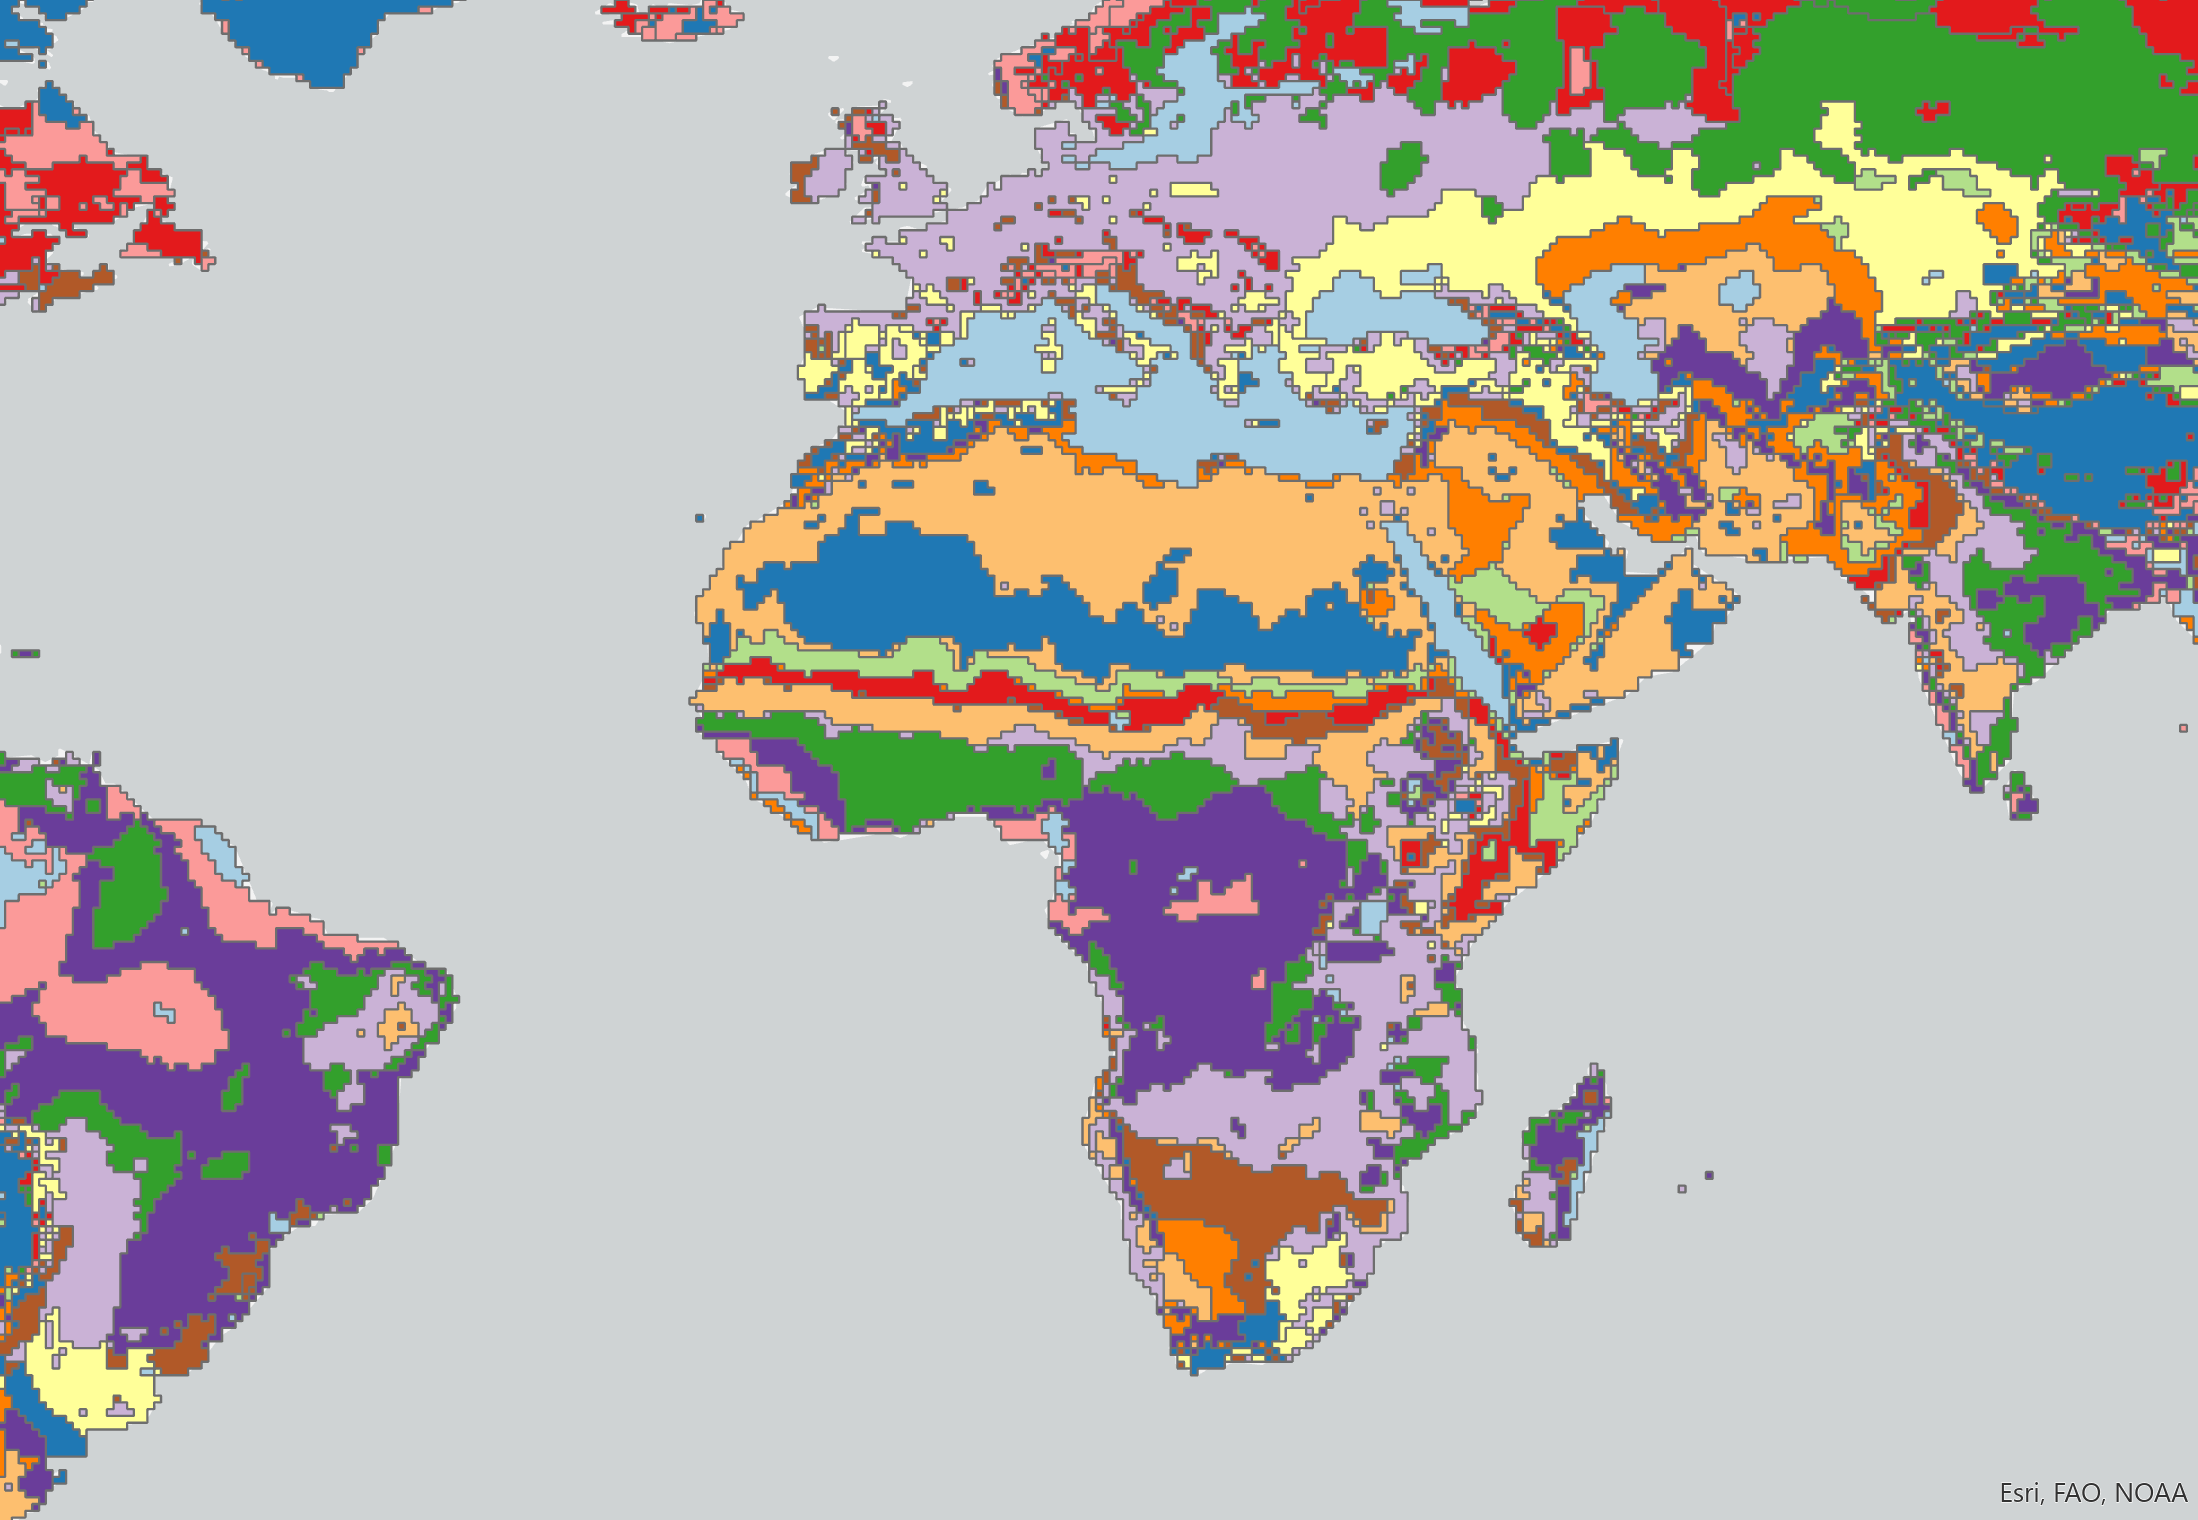
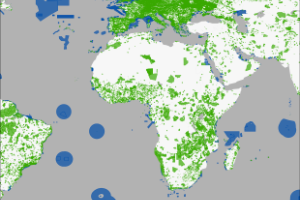
The pressure on carbon storing ecosystems are similar in nature to those on biodiversity as captured by the human footprint (HF) map. Nevertheless, we recognised specific drivers of change in belowground carbon sinks such as wetland drainage and soil disturbance and erosion which are not necessarily linked to biodiversity loss or described by the HF. However, due to a paucity of globally consistent spatial data on these drivers, we omitted them from this analysis. We used fires and climate change risk as the two major pressures on carbon. We used the number and intensity of active fives for a 5 year period (from January 2015 - December 2019) from MODIS active fire data as the fire risk layer. Climate risk was estimated based on the difference between average annual future temperature for the reference year 2050 and mean annual historic temperature (1970 – present) (Karger et al. 2017).
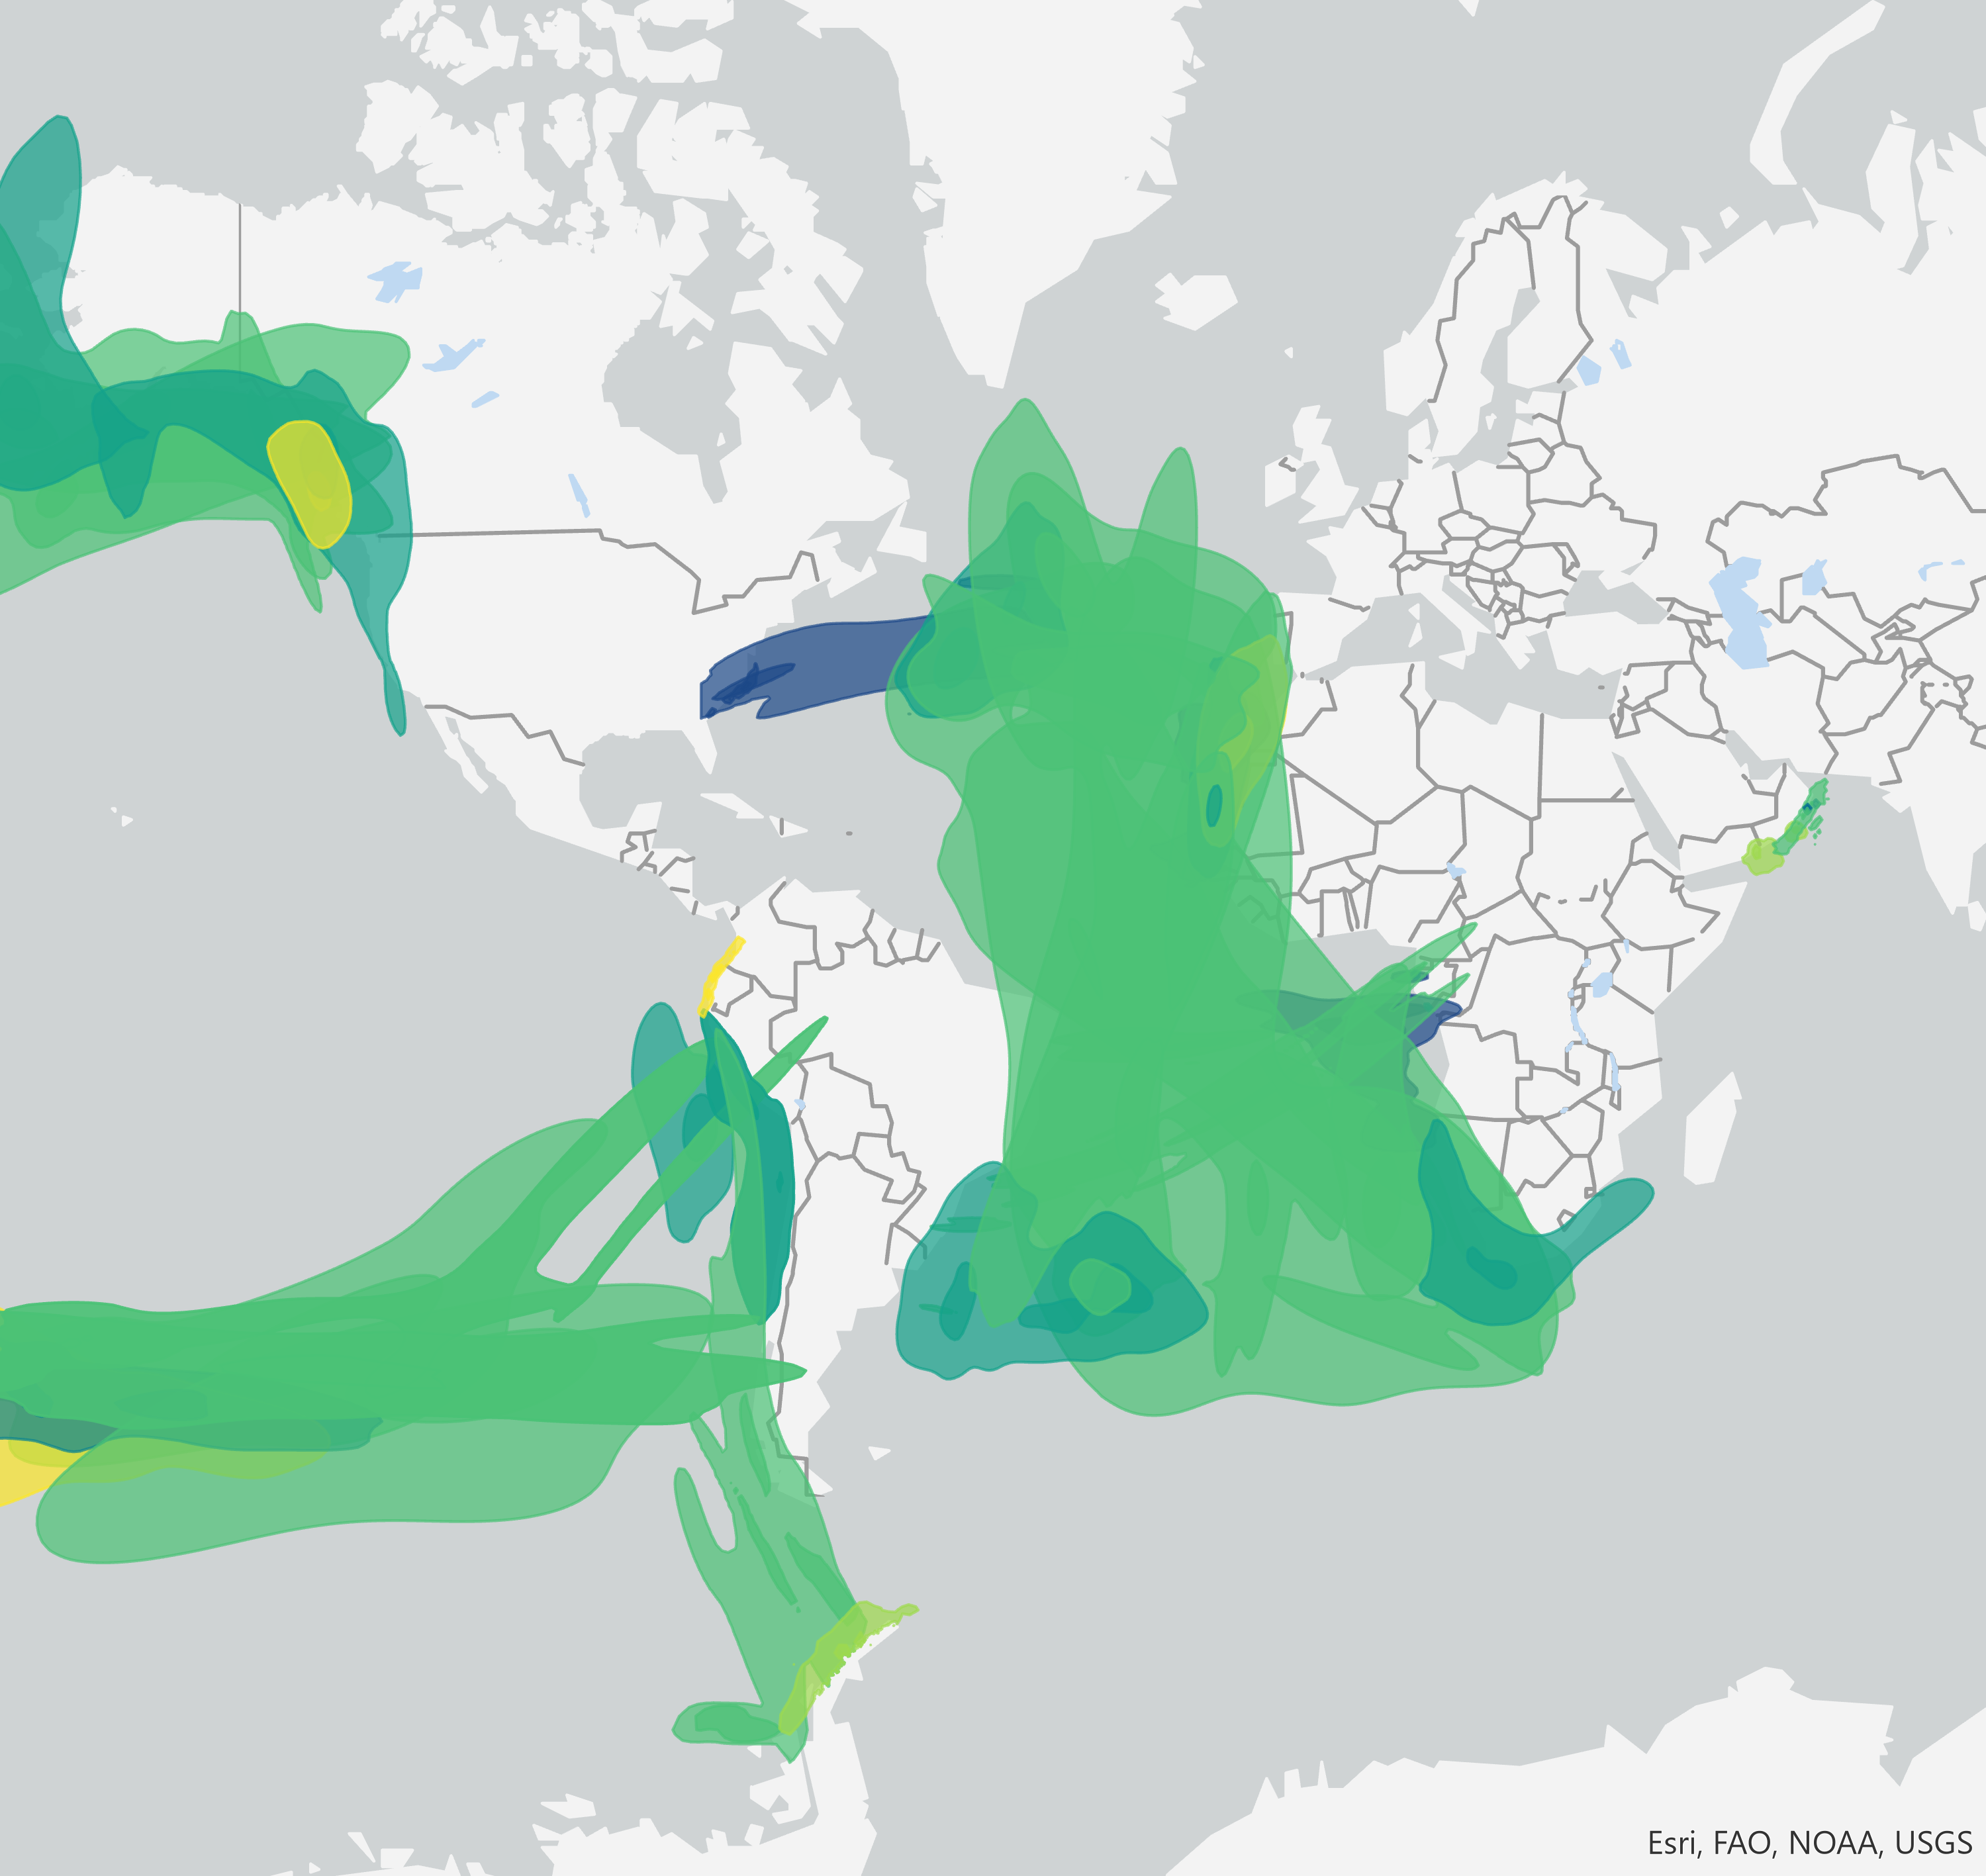
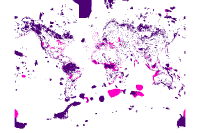
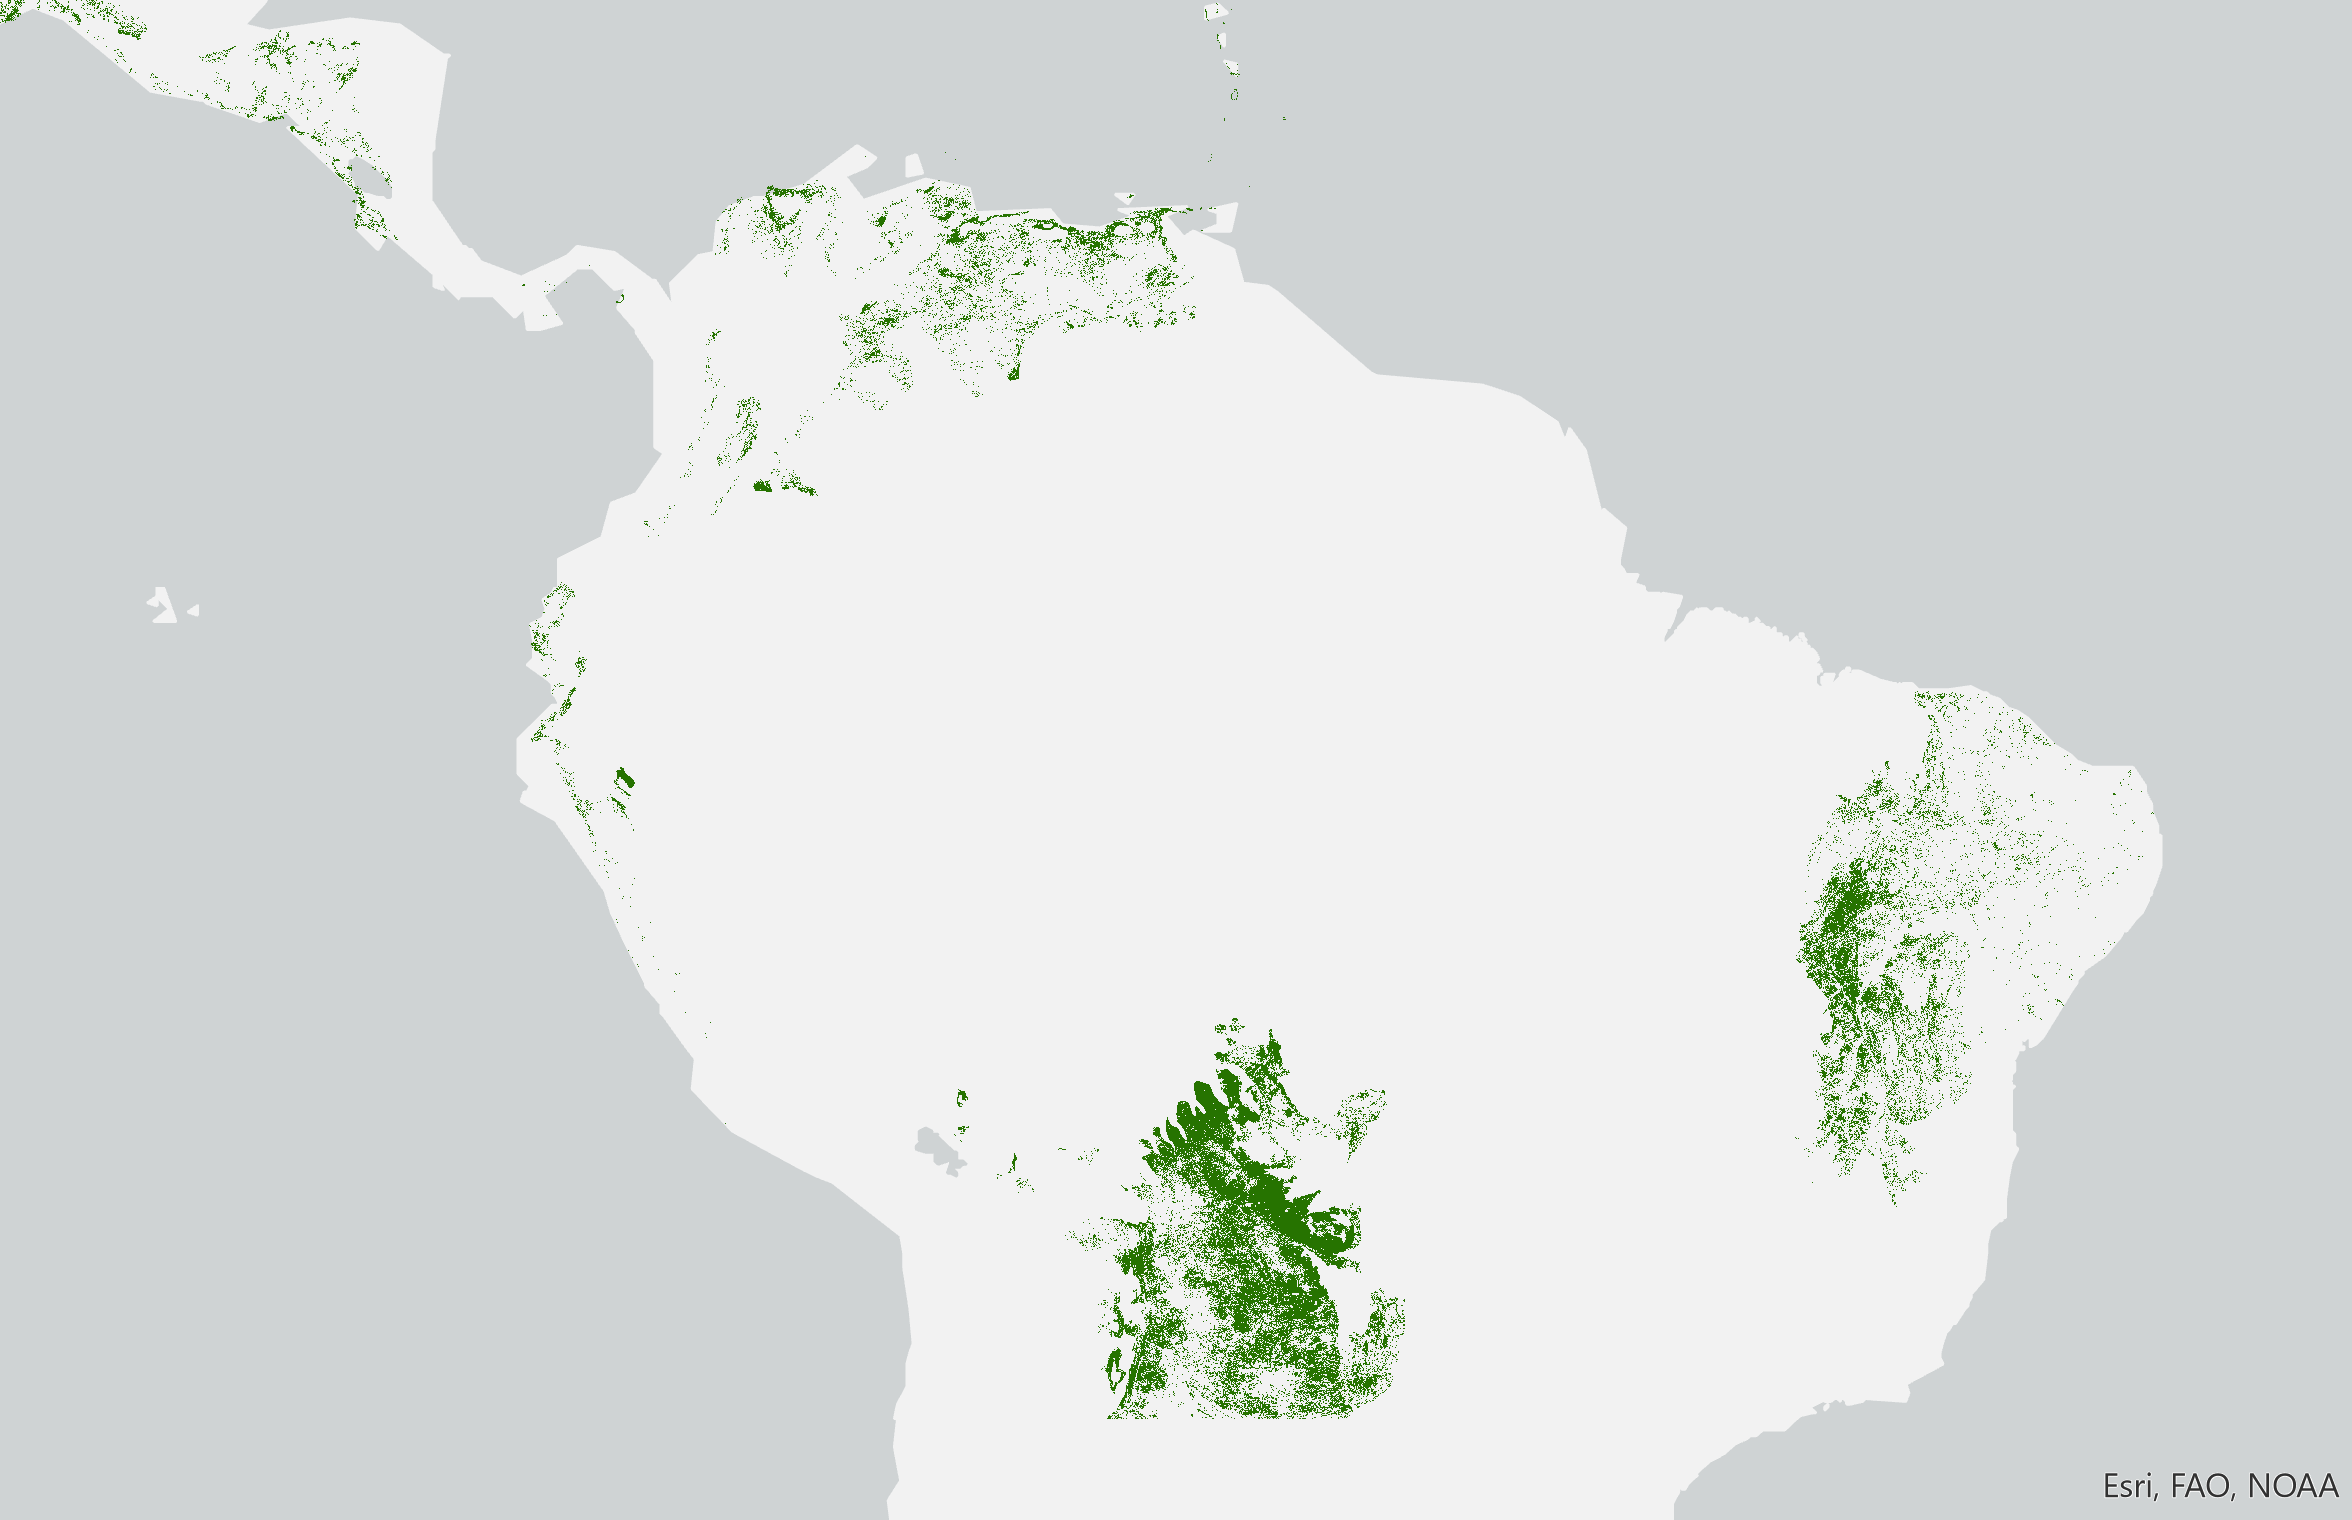
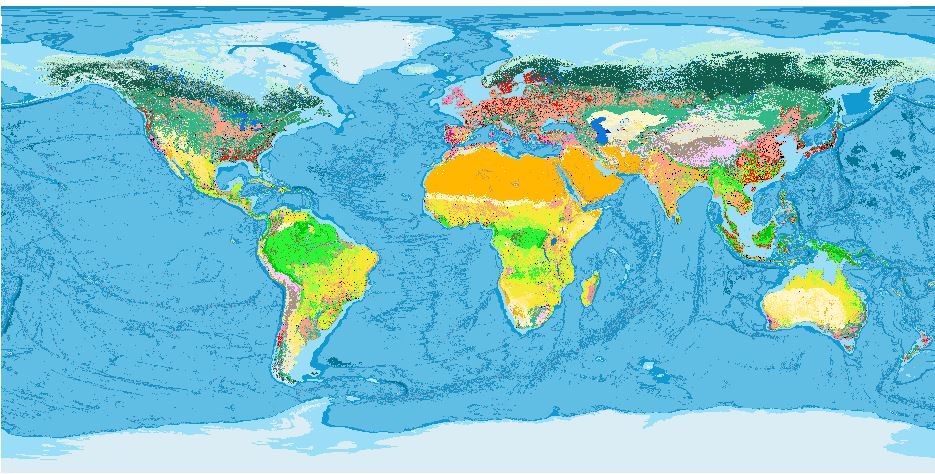
Finally, these three layers were combined into one single layer to illustrate broad scale patterns of cumulative human pressures in order to ascertain where the intrinsic values of nature are most at risk.